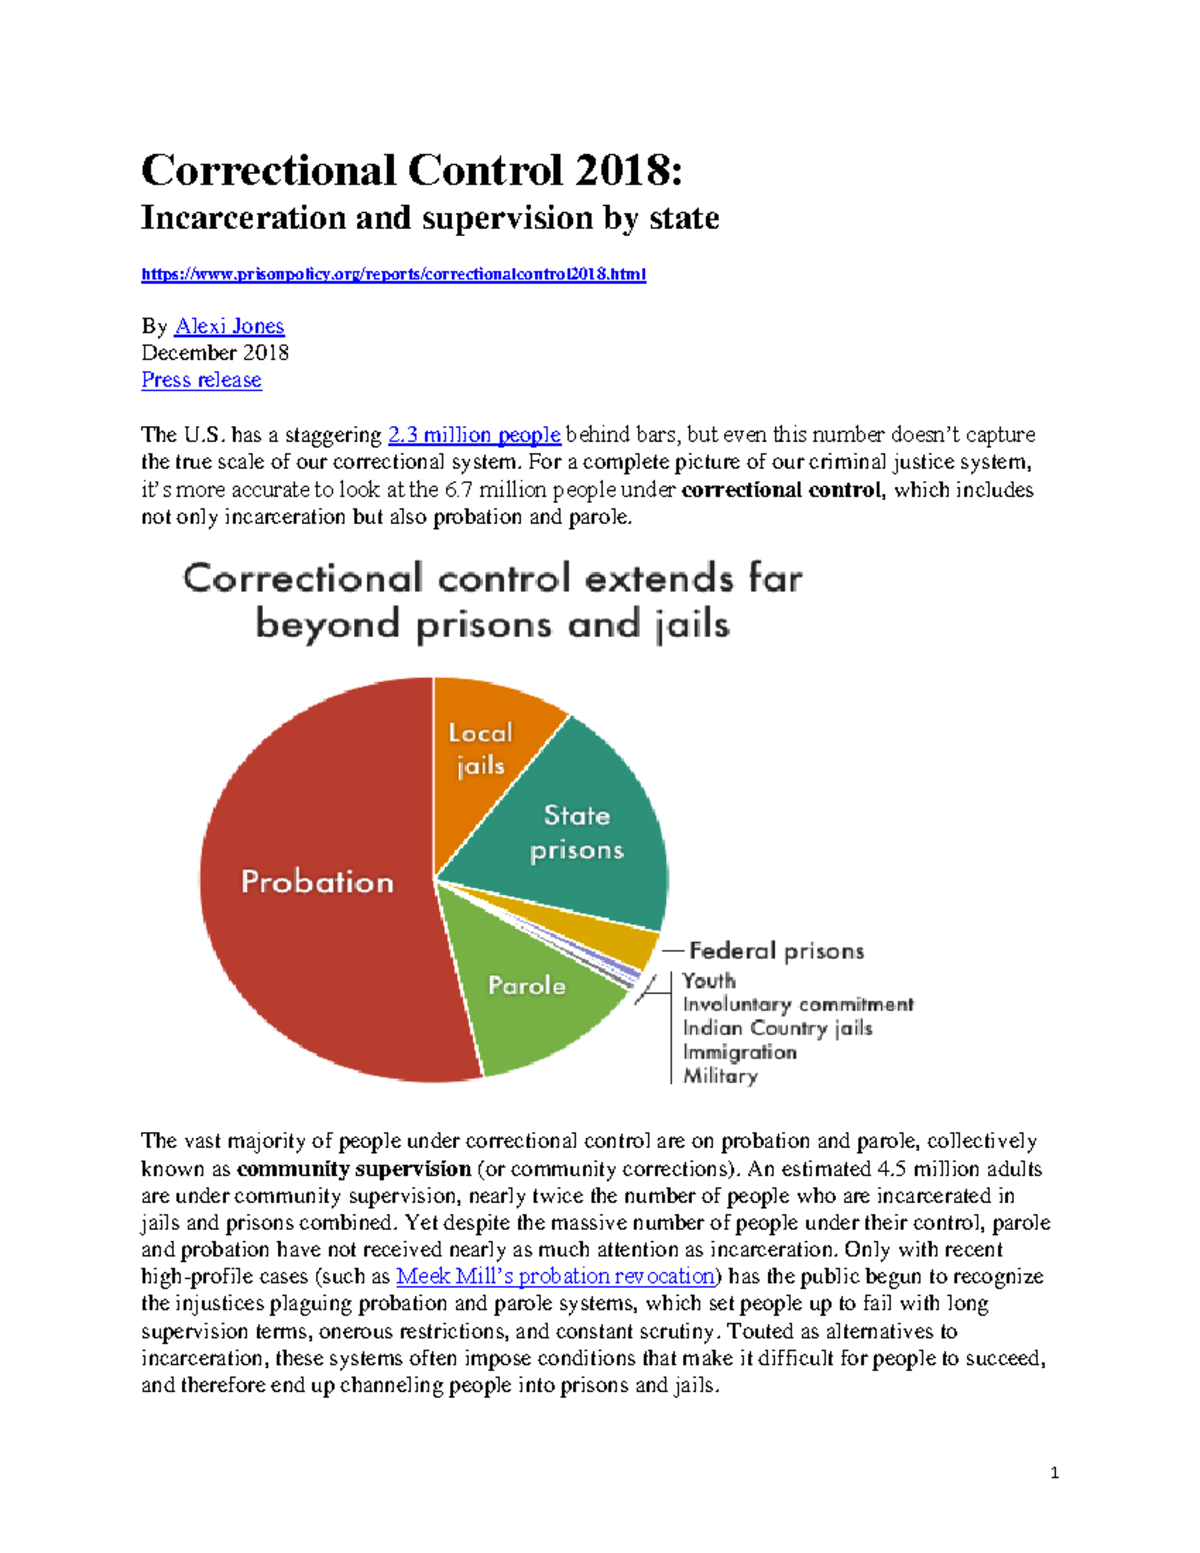
In 2018, the United States incarceration landscape reached a critical inflection point, characterized by the passage of the First Step Act and a continued decline in the national imprisonment rate. Data from the Bureau of Justice Statistics (BJS) indicates that approximately 2.1 million individuals were held in federal, state, and local facilities, marking the lowest imprisonment rate since 1996.
The Landscape of American Incarceration in 2018
The year 2018 is frequently cited by criminologists and policy analysts as a benchmark year for criminal justice reform. To understand the significance of incarceration in 2018, one must first distinguish between the various types of confinement facilities: federal prisons, state prisons, and local jails. While these terms are often used interchangeably in casual conversation, their populations, jurisdictions, and the legal frameworks governing them differed significantly during this period.
According to the Bureau of Justice Statistics report "Prisoners in 2018," there were an estimated 1,465,200 prisoners under the jurisdiction of state and federal correctional authorities on December 31, 2018. This represented a 1.6% decrease from the previous year. When examining the broader picture, including those held in local jails, the total number of incarcerated persons was approximately 2.1 million. This decline was part of a larger trend that began roughly in 2009, following decades of exponential growth in the U.S. prison population.
The "imprisonment rate" specifically refers to the number of prisoners sentenced to more than one year per 100,000 U.S. residents. In 2018, this rate fell to 431 per 100,000, a level not seen since the mid-1990s. This decline was driven largely by changes in state-level policies and a shifting federal approach toward non-violent drug offenses. However, despite these reductions, the United States maintained one of the highest incarceration rates in the world, a fact that fueled the bipartisan momentum for the year’s most significant legislative achievement: the First Step Act.
The First Step Act of 2018: A Legislative Turning Point
On December 21, 2018, the First Step Act (FSA) was signed into law. This legislation represented the most substantial overhaul of the federal justice system in a generation. While the act primarily applied to the federal prison population—which accounts for only about 10% of the total incarcerated population in the U.S.—its symbolic and procedural impacts were profound.
The First Step Act was designed with two primary goals: to reduce recidivism and to correct specific sentencing disparities that had disproportionately affected minority communities. One of the most critical components of the FSA was the retroactive application of the Fair Sentencing Act of 2010. This earlier law had reduced the disparity between crack and powder cocaine sentencing, but it did not originally apply to those already serving time. The 2018 legislation allowed inmates sentenced under the old guidelines to petition for sentence reductions, leading to the immediate release or shortened sentences for thousands of individuals.
Furthermore, the FSA introduced a "Risk and Needs Assessment" system. This tool was designed to determine the recidivism risk of federal inmates and provide them with opportunities to earn "time credits" by participating in evidence-based recidivism reduction programs. These credits could then be used to secure earlier placement in halfway houses or home confinement. The implementation of this system in late 2018 and throughout 2019 marked a shift from a purely punitive model toward one that incentivized rehabilitation and reentry preparation.
Key Provisions of the Legislation
Beyond sentencing and recidivism credits, the First Step Act addressed several humanitarian concerns within federal facilities. It prohibited the shackling of pregnant women, a practice that had long been criticized by human rights organizations. It also mandated that inmates be placed in facilities within 500 driving miles of their primary residence, whenever possible, to facilitate family visitation—a factor strongly correlated with successful reintegration into society.
The act also expanded "compassionate release" for elderly and terminally ill inmates. Before 2018, the process for requesting such release was notoriously difficult, as the Bureau of Prisons (BOP) held exclusive authority to file motions for release with the courts. The FSA changed this by allowing inmates to petition the courts directly after exhausting their administrative remedies within the BOP. This change proved vital for many individuals who no longer posed a threat to public safety but were suffering from debilitating health conditions.
Comparing Federal vs. State Incarceration Trends in 2018
While the federal government was focused on the First Step Act, state-level incarceration trends in 2018 showed a more varied picture. States hold the vast majority of the nation’s prisoners, and in 2018, state prison populations decreased in 28 states while increasing in 22 others. This divergence highlights the localized nature of criminal justice policy in the U.S.
In 2018, states like California, New York, and Maryland continued to see significant drops in their prison populations due to ongoing reforms such as "realignment" (shifting non-violent offenders to local county jurisdiction) and the elimination of mandatory minimums for certain offenses. Conversely, several states in the South and Midwest saw population increases, often driven by the ongoing opioid crisis and the resulting surge in drug-related arrests and parole revocations.
The financial burden of state incarceration in 2018 remained immense. States spent an estimated $60 billion annually on corrections, a figure that often competed with budgets for higher education and infrastructure. This economic reality was a major driver for conservative-led reforms in states like Texas and Georgia, where "smart on crime" initiatives sought to reduce prison costs by expanding drug courts and community supervision programs rather than relying solely on long-term confinement.
| Category | 2018 Estimated Value | Historical Context/Trend |
|---|---|---|
| Total Incarcerated Population | 2.1 Million | Down from a peak of ~2.3 million in 2008. |
| Federal Prison Population | 179,898 | Decreased by 1.7% compared to 2017. |
| State Prison Population | 1,285,302 | Decreased by 1.6% compared to 2017. |
| Local Jail Population | 738,400 | Remains relatively stable compared to prior years. |
| Imprisonment Rate | 431 per 100,000 | Lowest rate recorded since 1996. |
| First Step Act Impact | ~3,000+ early releases | Immediate impact from Fair Sentencing Act retroactivity. |
Demographic Disparities and Trends in 2018
Despite the overall decline in incarceration rates, 2018 data revealed that deep-seated demographic disparities remained a defining characteristic of the American justice system. The Bureau of Justice Statistics reported that in 2018, Black Americans were incarcerated at nearly six times the rate of White Americans. While this gap had been narrowing slowly over the previous decade, the disproportionate impact on communities of color remained a central point of debate for reform advocates.
For Hispanic/Latino populations, the incarceration rate was approximately three times that of Whites. These disparities were not only limited to the number of people behind bars but also extended to the length of sentences and the likelihood of receiving parole. The 2018 "Prisoners" report noted that while the number of Black men in state or federal prison had declined significantly from its peak in 2006, they still comprised 33% of the total prison population, despite making up only about 12% of the U.S. population.
The incarceration of women also presented a unique trend in 2018. While the male prison population declined by 1.7% from 2017 to 2018, the female prison population declined at a slightly slower rate (1.4%). Over a longer 10-year horizon, the number of women in prison had actually increased in several states, often due to harsher sentencing for drug offenses and a lack of gender-responsive reentry programs.
Socioeconomic Impacts of Incarceration Policies in 2018
The consequences of incarceration in 2018 extended far beyond the walls of the prison. The "collateral consequences" of a criminal conviction—including barriers to employment, housing, and voting—continued to impact millions of Americans. In many states, a felony conviction in 2018 resulted in the permanent or long-term loss of voting rights, a practice known as felony disenfranchisement. However, 2018 also saw a landmark movement on this front, most notably in Florida, where voters passed Amendment 4, which aimed to restore voting rights to over a million people with prior felony convictions.
Economically, the impact of 2018 incarceration was felt most acutely by families. An estimated 2.7 million children in the U.S. had an incarcerated parent in 2018. The loss of a primary breadwinner often pushed families into poverty, creating a cycle of instability that researchers have linked to higher rates of future justice involvement for those children. The First Step Act's focus on placing inmates closer to home was a direct attempt to mitigate some of these socioeconomic fractures by preserving family bonds.
From a labor perspective, the high incarceration rates of 2018 were seen by some economists as a drain on the national GDP. The "prison-to-workforce" pipeline was a major area of focus for the Department of Labor, which in 2018 began expanding grants for vocational training within correctional facilities. The goal was to ensure that individuals returning to society possessed marketable skills in industries like welding, coding, and HVAC repair, thereby reducing the likelihood of recidivism.
Measuring the Long-Term Progress Since 2018
Looking back from 2026, the year 2018 stands out as the beginning of a "decarceration" era that faced significant challenges. While the First Step Act was a success in its initial years—reducing the federal prison population and proving that sentencing reform could pass with bipartisan support—it also faced hurdles in implementation. Issues with the DOJ’s risk-assessment algorithm and delays in the rollout of earned time credits meant that some of the act’s promises were not fully realized until the early 2020s.
The 2018 data also provided a baseline for understanding the massive shifts that occurred shortly thereafter. The policy changes enacted in 2018 were tested by the unforeseen challenges of the 2020-2022 period, where health crises in correctional facilities forced an acceleration of early release programs and a re-evaluation of the necessity of pretrial detention for non-violent offenders.
Ultimately, 2018 proved that a combination of legislative action and data-driven policy could move the needle on mass incarceration. The statistics from that year showed that the U.S. was capable of reducing its prison population without a corresponding increase in crime rates, a finding that bolstered the case for the "Second Step" reforms that were debated in subsequent legislative sessions.
FAQ
What was the most significant law passed regarding incarceration in 2018?
The First Step Act (FSA) was the most significant law. Signed in December 2018, it focused on federal prison reform, including reducing mandatory minimum sentences for certain drug offenses, making the Fair Sentencing Act of 2010 retroactive, and introducing a system for inmates to earn time credits for participating in rehabilitative programs.
Did incarceration rates go up or down in 2018?
According to the Bureau of Justice Statistics, the overall incarceration rate went down. The imprisonment rate for individuals sentenced to more than a year was 431 per 100,000 U.S. residents, which was the lowest level since 1996. The total number of people in state and federal prisons fell by 1.6% from 2017 to 2018.
How many people were in prison in the United States in 2018?
Approximately 1,465,200 people were held in state and federal prisons at the end of 2018. If you include individuals held in local jails (roughly 738,400), the total population behind bars was approximately 2.1 million people.
How did the First Step Act affect crack cocaine sentencing in 2018?
The First Step Act allowed individuals who were sentenced for crack cocaine offenses before August 3, 2010, to petition the courts for a sentence reduction. This was a retroactive application of the Fair Sentencing Act, which corrected the 100-to-1 sentencing disparity between crack and powder cocaine. By the end of 2019, thousands of federal inmates had their sentences reduced or were released because of this 2018 provision.
What is the difference between the 2018 prison population and jail population?
Prisons (federal and state) typically hold individuals convicted of felonies who are serving sentences longer than one year. Jails (local) usually hold individuals awaiting trial or those convicted of misdemeanors serving shorter sentences. In 2018, the prison population saw a notable decline, while the local jail population remained relatively steady.
Were there demographic changes in incarceration in 2018?
Yes, but disparities remained high. While the gap between Black and White incarceration rates continued a long-term narrowing trend, Black Americans in 2018 were still incarcerated at 5.9 times the rate of White Americans. The 2018 data highlighted that while reform was happening, it was not affecting all demographics equally.
Practical Recommendation for Researchers and Advocates
When analyzing 2018 incarceration data for policy research or advocacy, it is essential to utilize the official reports from the Bureau of Justice Statistics (BJS), specifically the "Prisoners in 2018" and "Jail Inmates in 2018" bulletins. These documents provide the most granular data on age, sex, race, and offense types. For those interested in the legislative impact, the United States Sentencing Commission (USSC) provides detailed "First Step Act Reports" that track the number of sentence reductions and releases by jurisdiction. Always cross-reference federal statistics with state-level Department of Corrections (DOC) annual reports to get a complete picture of the geographic variations in reform progress.