The 2019 market was defined by a remarkable paradox: it saw one of the strongest bull runs in equity history despite persistent trade tensions and fears of an impending global slowdown. Driven by a dramatic "dovish" pivot from the Federal Reserve, the S&P 500 delivered a total return of approximately 28.9%, making it the best year for U.S. stocks since 2013 and a critical baseline for analyzing long-term economic cycles from our current 2026 perspective.
The Macroeconomic Backdrop: The Year of the "Great Pivot"
To understand the 2019 market, one must first look at the transition from 2018. The end of 2018 was marked by extreme volatility and a sharp correction, largely due to the Federal Reserve’s aggressive interest rate hikes and the "Quantitative Tightening" program. As 2019 began, the narrative shifted entirely.
The Federal Reserve’s About-Face
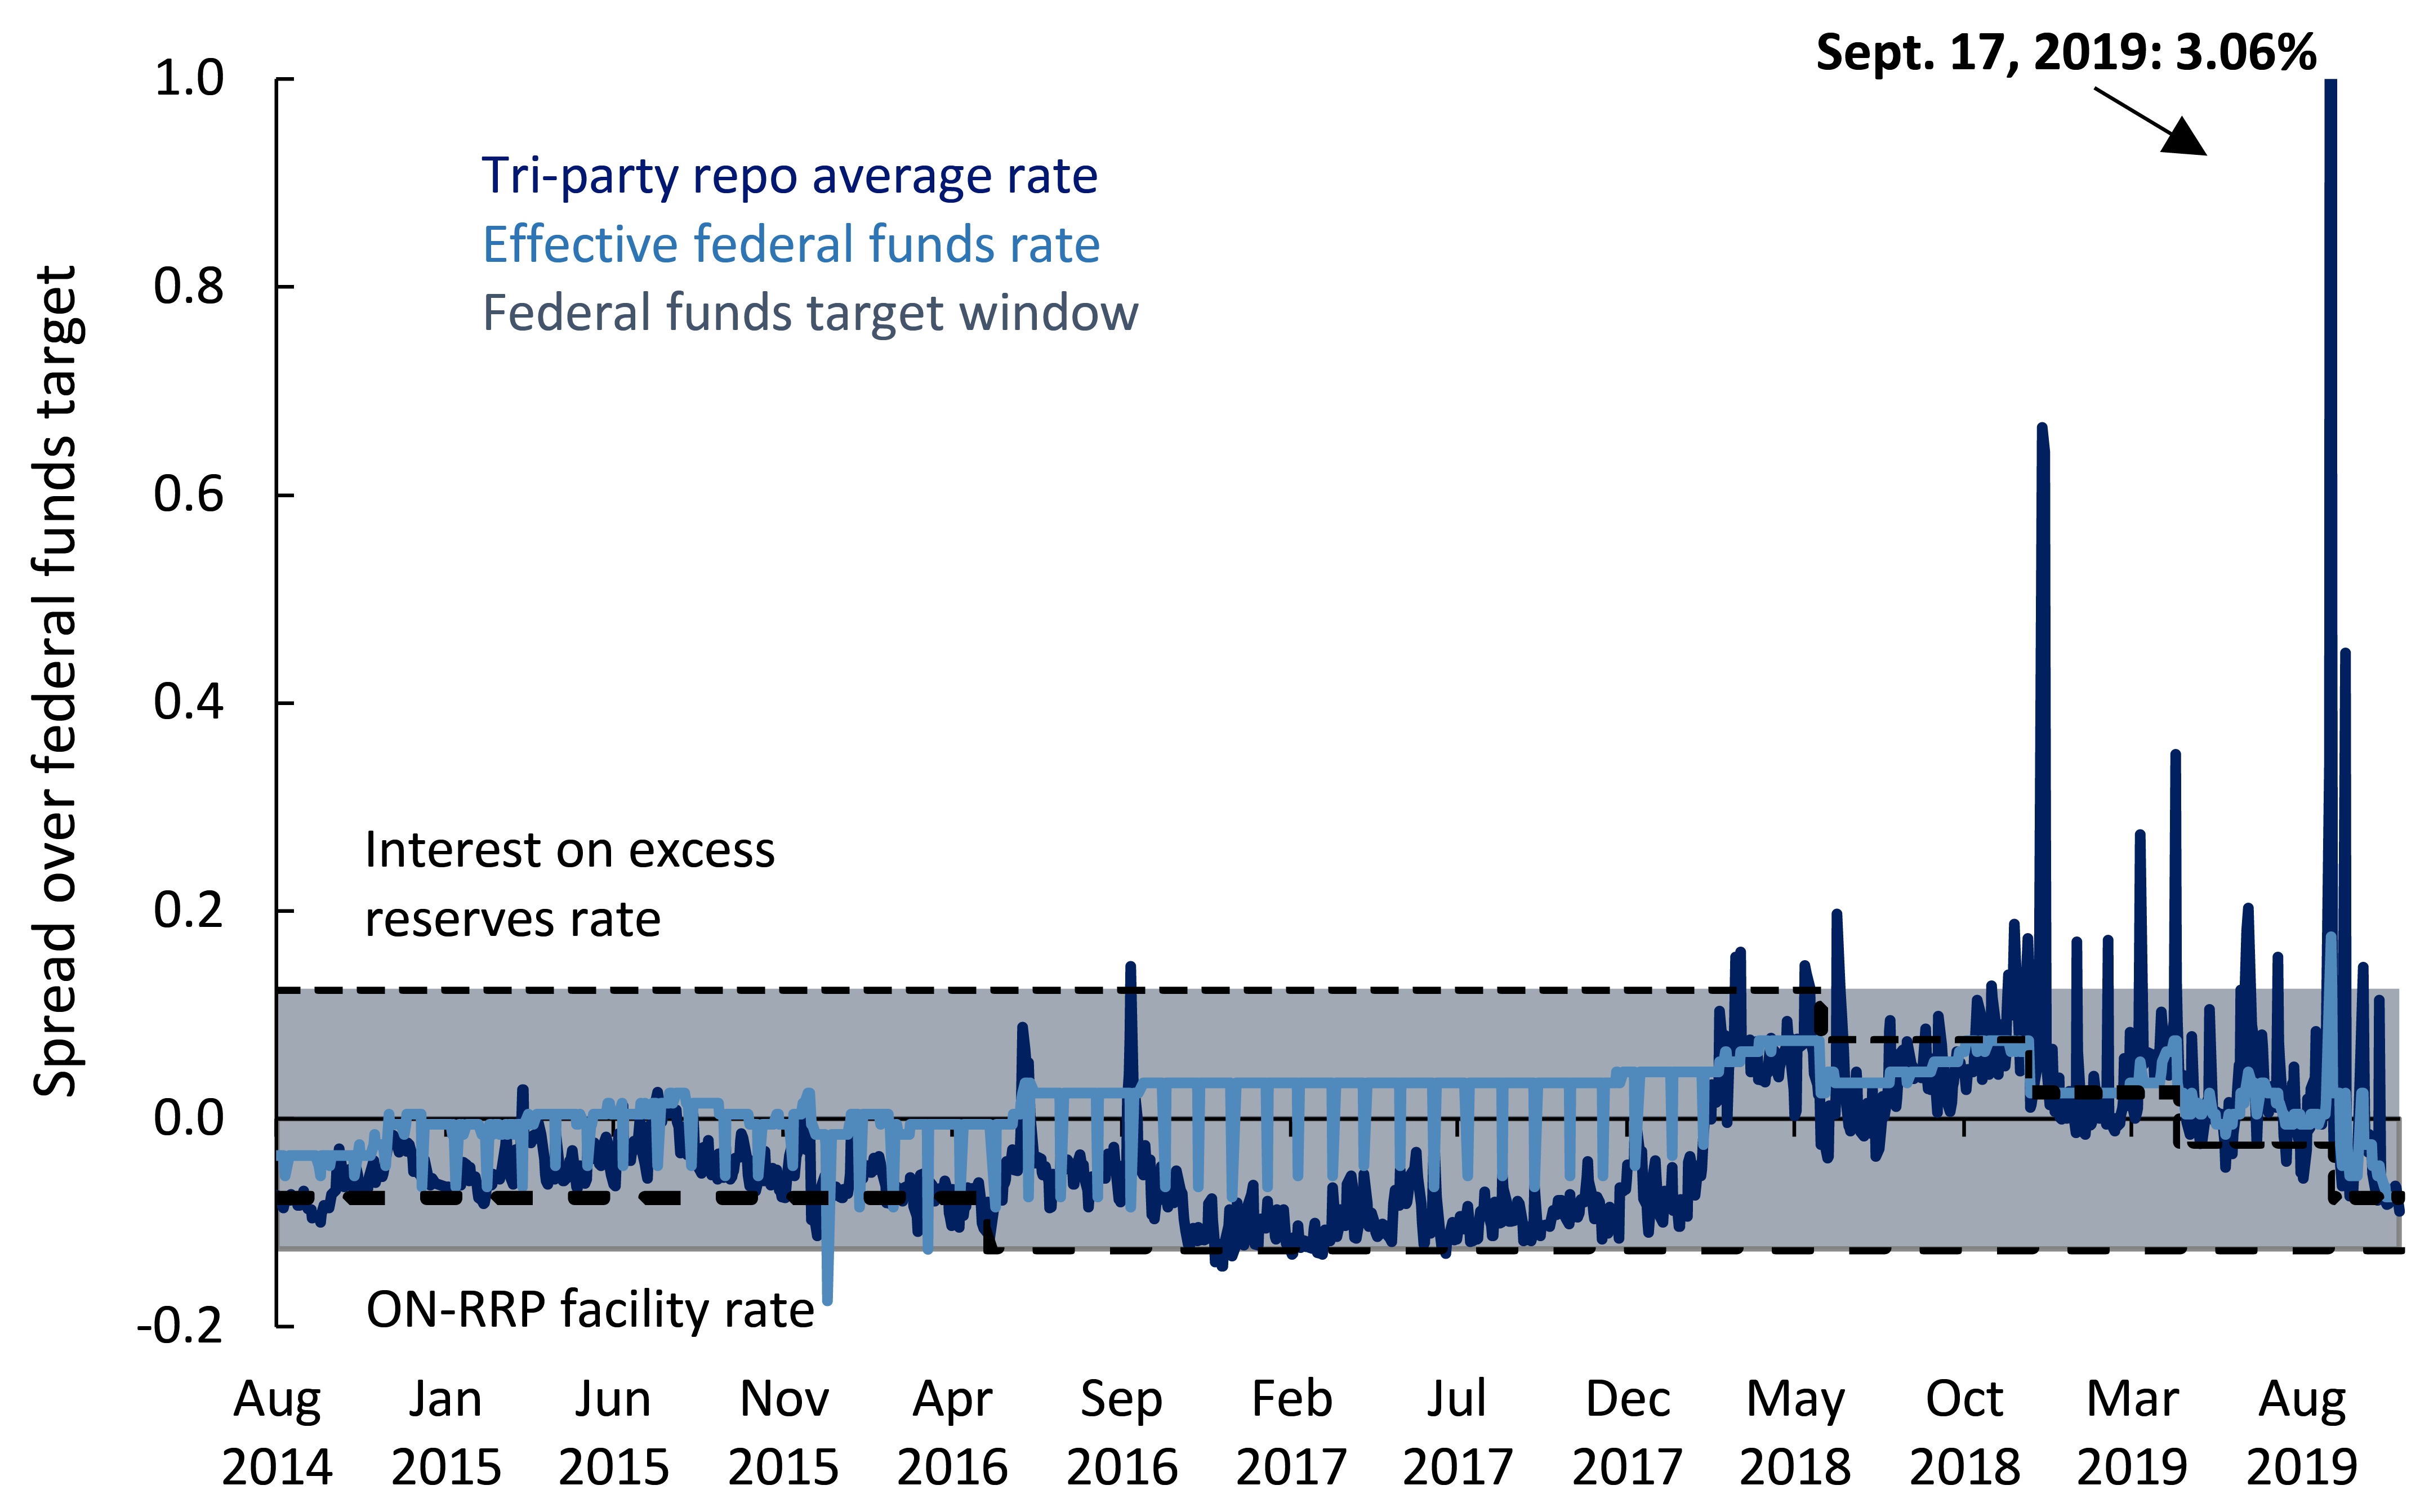
In early 2019, Federal Reserve Chairman Jerome Powell signaled a "patient" approach to further rate hikes. This was a significant departure from the December 2018 stance. By mid-year, the Fed moved from holding rates steady to actively cutting them. They implemented three "insurance" rate cuts—lowering the federal funds rate by 25 basis points each in July, September, and October.
This policy shift was designed to protect the U.S. economy from slowing global growth and the fallout from international trade disputes. For investors, this liquidity injection served as high-octane fuel for asset prices. In the context of 2026 financial analysis, 2019 remains a textbook example of how monetary policy can decouple financial markets from underlying economic uncertainty.
The Inverted Yield Curve and Recession Fears
In August 2019, a technical indicator sent shockwaves through the 2019 market: the inversion of the yield curve. Specifically, the yield on the 10-year Treasury note fell below the yield on the 2-year Treasury note. Historically, this phenomenon has been a reliable precursor to economic recessions.
The inversion triggered widespread media coverage and heightened anxiety among institutional investors. However, unlike previous cycles, the recession did not materialize immediately in 2019. Instead, the market looked past the warning sign, emboldened by strong consumer spending and a robust labor market. Looking back from 2026, we can see that while the yield curve was a valid signal of fragility, the unique interventionist policies of the era delayed the traditional economic fallout.
Equity Markets: A Year of Broad-Based Rallies
Despite the "wall of worry," almost every major asset class finished 2019 in the green. It was a rare year where stocks, bonds, and gold all rose simultaneously, reflecting a massive influx of capital looking for safety and growth.
S&P 500 and the Tech Sector
The S&P 500’s near 30% gain was heavily concentrated in the Information Technology sector, which surged nearly 48% over the year. Companies like Apple and Microsoft saw massive appreciation, driven by the expansion of cloud computing and the initial deployments of 5G technology. These tech giants began to cement their status as "safe-haven" growth stocks—a trend that would continue for the next several years.
International Performance
While the U.S. led the way, international markets also performed surprisingly well. The MSCI EAFE index, which tracks developed markets in Europe, Australasia, and the Far East, returned over 22% in 2019. Even the emerging markets, though dampened by trade volatility, managed a return of roughly 18%. This synchronized global rally was a direct result of global central banks following the Fed's lead in easing monetary conditions.
The Impact of the US-China Trade War
No analysis of the 2019 market is complete without discussing the geopolitical tension between the world’s two largest economies. Throughout 2019, the "trade war" was the primary source of intraday volatility.
Tariff Escalations
The year saw a series of tit-for-tat tariff escalations. The U.S. increased tariffs on hundreds of billions of dollars worth of Chinese imports, and China retaliated with duties on American agricultural products and manufactured goods. Each tweet or official statement regarding the progress of trade talks moved the markets significantly.
The Phase One Deal
The market tension finally eased in December 2019 when both nations announced a "Phase One" trade agreement. This deal included commitments from China to increase purchases of U.S. goods and improved protections for intellectual property. While the deal was limited in scope, its announcement removed the immediate threat of further escalation, allowing the 2019 market to end on an all-time high. This era marked a shift in how investors priced in geopolitical risk, recognizing that "headline risk" often created buying opportunities during a liquidity-rich environment.
The 2019 IPO Boom: A Mixed Legacy
2019 was also the year of the "Unicorn" IPO. Large, venture-backed startups that had remained private for a decade finally hit the public markets. However, the performance of these IPOs was a sobering reminder that private valuations do not always translate to public market success.
- Lyft and Uber: These ride-sharing giants went public in early 2019 with massive fanfare. However, both struggled initially as investors questioned their paths to profitability.
- The WeWork Collapse: Perhaps the most significant event in the 2019 private-to-public pipeline was the failed IPO of WeWork. After a sky-high private valuation of $47 billion, the company’s S-1 filing revealed massive losses and governance issues. The IPO was withdrawn, leading to a total restructuring.
- Success Stories: In contrast, companies like Beyond Meat and Zoom Video Communications saw spectacular debuts, signaling a shift in investor interest toward sustainable alternatives and remote-work infrastructure (the latter being particularly prescient).
Real Estate and Housing Trends in 2019
The 2019 real estate market benefited directly from the Federal Reserve’s rate cuts. As the 10-year Treasury yield dropped, mortgage rates followed suit, falling from nearly 5% at the end of 2018 to below 4% by late 2019.
Residential Market Dynamics
Low mortgage rates spurred a wave of refinancing and home buying. However, the market faced a persistent challenge: low inventory. Construction of new single-family homes had not yet returned to pre-2008 levels, leading to rising home prices in most major U.S. metropolitan areas. For many prospective buyers in 2019, the "affordability crisis" became a dominant theme, as price appreciation outpaced wage growth.
Commercial Real Estate Shifts
In the commercial sector, 2019 saw the beginning of a divergence that would later be accelerated by the pandemic. Industrial real estate—specifically warehouses and distribution centers—boomed due to the continued rise of e-commerce. Meanwhile, the retail real estate market continued to struggle with the "retail apocalypse," as traditional malls faced declining foot traffic and store closures.
Asset Class Performance Comparison Table
The following table summarizes the performance of key market indicators throughout the 2019 calendar year.
| Asset Class / Index | 2019 Total Return (Approx.) | Key Driver |
|---|---|---|
| S&P 500 (U.S. Large Cap) | 28.9% | Fed rate cuts and Tech sector dominance. |
| Nasdaq Composite | 35.2% | Explosive growth in software and semiconductors. |
| Gold | 18.3% | Demand for safe-haven assets amid trade war. |
| WTI Crude Oil | 34.5% | OPEC+ production cuts and geopolitical risk. |
| U.S. 10-Year Treasury | 8.4% (Price Return) | Falling yields increased the value of existing bonds. |
| MSCI Emerging Markets | 18.4% | Recovery from 2018 lows despite trade friction. |
Fixed Income and the Bond Market
In a typical year, when stocks go up nearly 30%, bonds tend to struggle. However, 2019 was not a typical year. Because interest rates fell so sharply, the bond market saw significant price appreciation. The Bloomberg Barclays U.S. Aggregate Bond Index returned nearly 8.7%, its best performance in years.
This "everything rally" created a challenge for diversified investors. With bond yields falling (the 10-year Treasury yield started the year around 2.68% and ended near 1.92%), the "income" portion of fixed income became harder to find. This forced many investors into riskier "high-yield" or "junk" bonds to find returns, a trend that increased the overall systemic risk in the 2019 market.
Commodities: Oil, Gold, and Agriculture
The commodities market in 2019 was a story of supply-side management and geopolitical tension.
Energy Markets
Oil prices saw a strong recovery in 2019 after a dismal end to 2018. The OPEC+ alliance, led by Saudi Arabia and Russia, remained committed to production cuts to support prices. Additionally, tensions in the Strait of Hormuz and an attack on Saudi Aramco’s processing facilities in September provided temporary price spikes.
Precious Metals
Gold had its best year since 2010. Traditionally a hedge against inflation and uncertainty, gold’s 18% rise in 2019 was largely driven by the declining "opportunity cost" of holding the metal. When interest rates fall, the yield on cash and bonds drops, making non-yielding assets like gold more attractive.
Agriculture
U.S. farmers were at the center of the trade war. China, a major buyer of U.S. soybeans, halted purchases for much of the year. This led to a significant accumulation of stocks and depressed prices for several agricultural commodities, requiring the U.S. government to provide billions in trade aid to the farming sector.
Lessons from 2019 for the 2026 Investor
As we look back from 2026, the 2019 market serves as a vital case study in market resilience. It demonstrated that central bank intervention could effectively counteract geopolitical instability, at least in the short term.
- Don't Fight the Fed: 2019 proved the old adage. Even with a slowing global economy, the Fed's willingness to provide liquidity trumped fundamental concerns.
- Valuation vs. Momentum: The tech sector's performance showed that in a low-interest-rate environment, investors are willing to pay a high premium for future growth.
- The Limits of Sentiment: Despite the "recession" headlines caused by the yield curve inversion, the actual economic data (consumer spending and employment) remained positive. Investors who stayed the course were rewarded, while those who fled to cash missed one of the greatest years in market history.
Frequently Asked Questions (FAQ)
What was the main reason the stock market went up in 2019? The primary driver was the Federal Reserve's "pivot" from a hawkish stance (raising rates) to a dovish stance (cutting rates). The Fed lowered interest rates three times in 2019, which increased liquidity in the financial system and made equities more attractive relative to low-yielding bonds.
How did the 2019 trade war affect the average investor? For the average investor, the trade war created significant short-term volatility. Markets would often drop on news of new tariffs and rally on news of productive talks. However, by the end of the year, the "Phase One" deal helped stabilize markets, and long-term investors who didn't panic-sell generally saw significant gains due to the underlying strength of the tech sector.
Was 2019 a good year for real estate? Yes, 2019 was generally a strong year for real estate because mortgage rates fell significantly. This made home financing more affordable, although it also led to higher home prices due to increased demand and limited housing inventory. It was a particularly good year for industrial real estate and a challenging one for traditional retail space.
What happened to the "Unicorn" IPOs in 2019? The 2019 IPO market was a "reality check" for many high-profile startups. While companies like Zoom and Beyond Meat performed well, others like Uber and Lyft struggled to maintain their private-market valuations after going public. The most notable event was the collapse of WeWork's IPO, which forced venture capitalists to pivot their focus from "growth at any cost" to "sustainable profitability."
Why did gold rise in 2019 if the stock market was also rising? Gold rose because of falling real interest rates and global uncertainty. Typically, gold and stocks move in opposite directions, but in 2019, the lower yields on government bonds made gold a more attractive store of value. Additionally, the ongoing trade war encouraged investors to keep gold as a "safe-haven" hedge against a potential breakdown in global relations.
Next Actions for Investors: When analyzing historical periods like the 2019 market from a 2026 perspective, it is essential to review your current portfolio for "policy sensitivity." Just as 2019 was shaped by the Federal Reserve, current markets remain deeply influenced by central bank liquidity. Ensure your asset allocation accounts for both growth (equities) and protection (bonds/precious metals), and maintain a long-term view that prioritizes economic fundamentals over sensationalist headlines.