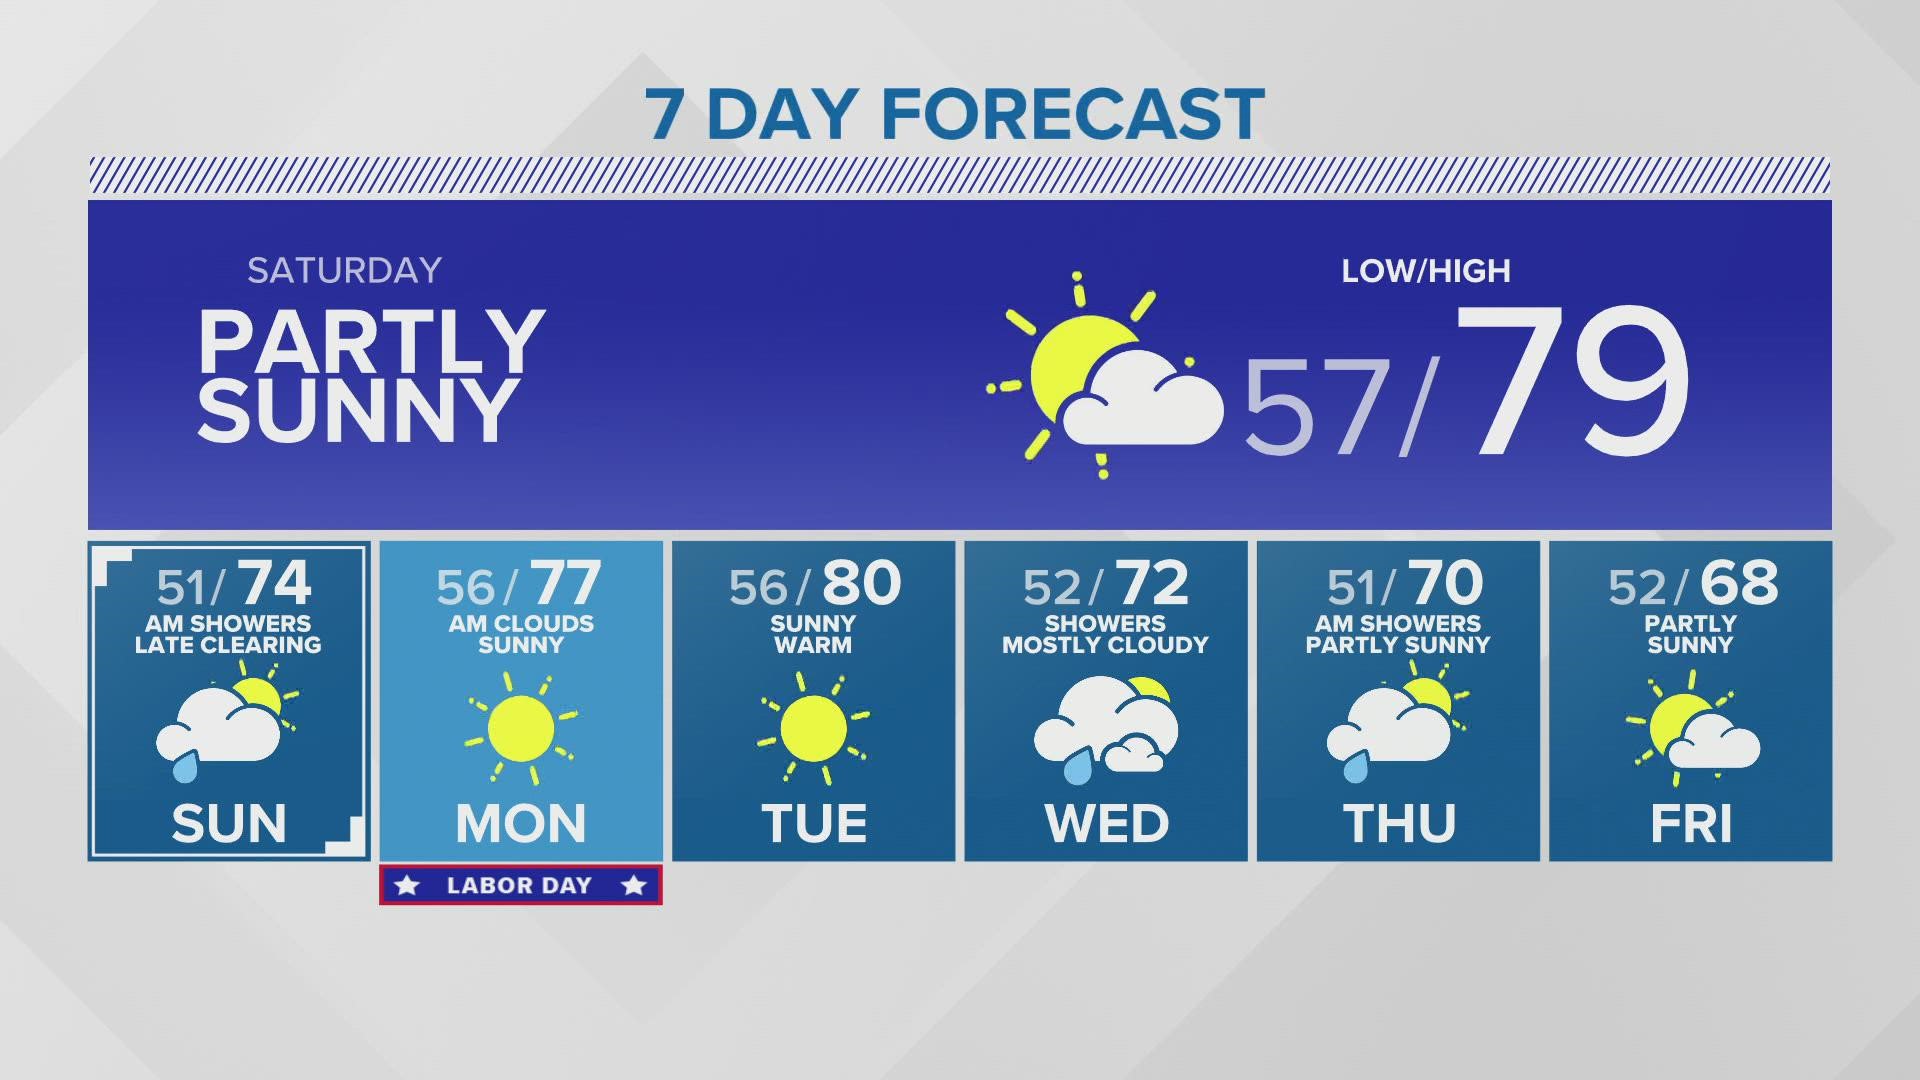
A 7-day forecast provides a predictive outlook of meteorological conditions for the week ahead, relying on numerical weather prediction models to estimate temperature, precipitation probability, wind speed, and sky cover. While highly valuable for planning, its reliability decreases as the time horizon extends, with accuracy typically declining significantly beyond the three-to-five-day window due to the chaotic nature of atmospheric systems.
Understanding the Mechanics of Weather Forecasting
Modern weather forecasting is a sophisticated blend of physics, mathematics, and high-performance computing. At the core of the 7-day forecast are Numerical Weather Prediction (NWP) models. These complex computer programs ingest vast amounts of observational data—collected from weather stations, satellites, weather balloons (radiosondes), aircraft, and ocean buoys—to represent the state of the atmosphere at a specific moment.
Once the initial state is established, the models apply equations of fluid dynamics and thermodynamics to project how the atmosphere will evolve over time. Because the atmosphere is a nonlinear system, small errors in the initial measurements can lead to large discrepancies in the output, a phenomenon known as the "butterfly effect." This is why a 7-day forecast is never a guarantee but rather a probabilistic model of likely outcomes.
The Accuracy Gradient and Decay
The accuracy of a 7-day forecast follows a predictable curve. Forecasts for the next 24 to 48 hours are generally highly accurate, as they capture the current momentum of weather systems. As you progress into days three and four, meteorologists can confidently predict the movement of large-scale pressure systems, such as fronts and high-pressure zones.
By days five through seven, the forecast becomes more uncertain. At this range, minor variations in the model’s variables—such as the exact track of a low-pressure system or the moisture content in the upper atmosphere—can result in vastly different outcomes for a specific location. Meteorologists often refer to this as the "limit of predictability." While improvements in supercomputing and satellite imagery have extended the useful range of these forecasts, the inherent instability of the atmosphere ensures that long-range predictions will always contain a margin of error.
Key Meteorological Indicators Explained
When reading a 7-day forecast, understanding the underlying metrics is essential for making informed decisions.
- Probability of Precipitation (PoP): This is perhaps the most misunderstood term in weather reporting. It represents the likelihood that measurable precipitation (typically 0.01 inches or more) will fall at any given point in the forecast area. It is calculated by multiplying the confidence that rain will develop in the region by the percentage of the area expected to receive it.
- Dew Point: This is a more accurate measure of humidity than relative humidity. A high dew point indicates high moisture content in the air, which often precedes storm development or makes heat feel more oppressive.
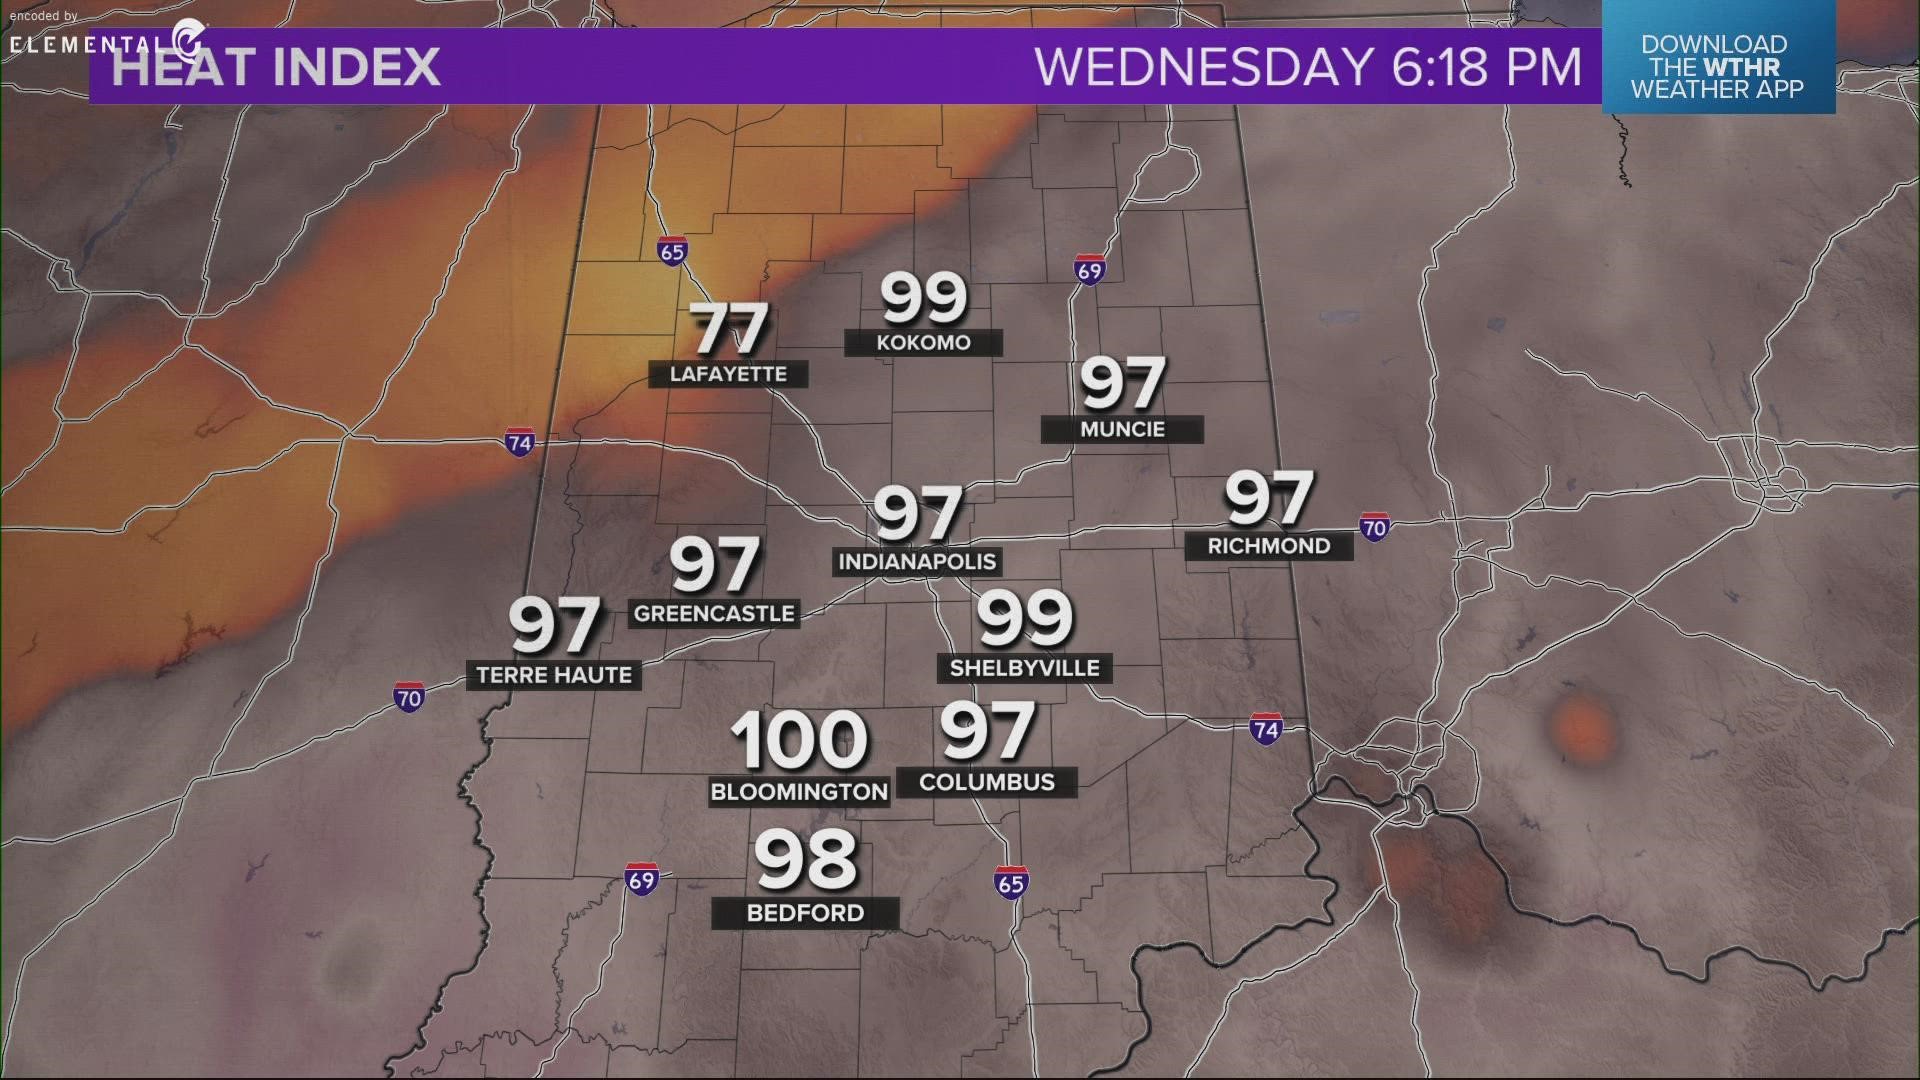
- Wind Chill and Heat Index: These are "apparent temperature" metrics. They adjust the actual air temperature to account for human perception, considering the cooling effect of wind or the insulating effect of humidity.
Comparison of Forecasting Model Horizons
To help navigate the complexities of weather data, it is useful to understand the different time horizons often presented in meteorological outlooks.
| Horizon | Primary Utility | Accuracy Level |
|---|---|---|
| Nowcasting (0-6 hours) | Immediate safety, severe weather alerts. | Very High |
| Short-Range (1-3 days) | Outdoor events, daily logistics. | High |
| Medium-Range (4-7 days) | Travel planning, agriculture preparation. | Moderate |
| Extended (8-14 days) | Long-term trend analysis and climate patterns. | Low/Experimental |
How to Use the 7-Day Forecast for Decision Making
Rather than treating the 7-day forecast as a binary "yes/no" guide for planning, view it as a tool for risk management. For instance, if you are planning an outdoor event, a 40% chance of rain on day seven should not lead to immediate cancellation. Instead, it should trigger a contingency plan.
Check the forecast at least twice daily. Because meteorological models are updated frequently—often every six to twelve hours as new data arrives—the forecast you see on a Monday morning for the following Sunday will be substantially more accurate when you check it again on Thursday or Friday.
Common Pitfalls and Troubleshooting
Users often misinterpret forecast data due to common misconceptions. Avoiding these errors will increase the utility of the information you receive:
- Over-relying on a single app: Many weather applications use automated, raw model output without human oversight. Relying on a single source can lead to skewed expectations. Consult a national weather service or a local meteorological agency that provides human-verified forecasts.
- Ignoring the "Trend": Look for consistency across multiple days. If the forecast consistently shows a drop in temperature over three days, that trend is more reliable than a single day’s data point.
- Local Geography Impacts: Standard 7-day forecasts often apply to a broad area. If you live in a region with complex topography—such as mountains, coastal areas, or deep valleys—local conditions can differ significantly from the regional forecast. Understanding your microclimate is a prerequisite for interpreting broad-scale model data.
Frequently Asked Questions
Why does the forecast change so much from one day to the next? As new data enters the prediction models, the initial conditions are refined. Even a small change in wind speed or temperature observed by a satellite halfway across the globe can shift a weather front by a few hundred miles in the computer model, resulting in a different outlook for your specific location.
What is the difference between a "Watch" and a "Warning"? A "Watch" means conditions are favorable for a particular weather event to occur, indicating that you should prepare. A "Warning" means the event is occurring or is imminent in your area, and you should take immediate action to protect yourself.
Are 7-day forecasts reliable for coastal or mountain regions? These regions are subject to "mesoscale" weather phenomena, which are smaller-scale patterns that global models often struggle to resolve perfectly. While the general trend of the 7-day forecast will be accurate, the specific timing or intensity of precipitation may vary.
What should I do if the forecast says 50% chance of rain for a week? A 50% chance over a long duration generally indicates an unsettled weather pattern where rain is possible at any time, rather than a continuous downpour. It is a signal that you should be prepared for intermittent weather disruptions.
Does a "mostly sunny" forecast mean no clouds at all? In meteorological terms, "mostly sunny" or "mostly clear" typically means that 1/8 to 2/8 of the sky is covered by clouds. It is distinct from "sunny" or "clear," which implies minimal cloud cover.
Recommendation for Effective Planning
To maximize the value of your 7-day forecast, adopt a "rolling confirmation" approach. Use the seven-day view to gauge general trends, such as shifting temperature patterns or the arrival of a major weather system. As you move closer to the date of interest, prioritize information from the 3-day window, as this remains the most reliable window for high-confidence decisions. If you are responsible for logistics involving property or safety, always supplement the digital forecast with alerts from an official meteorological body to ensure you have the most recent, expert-verified data.