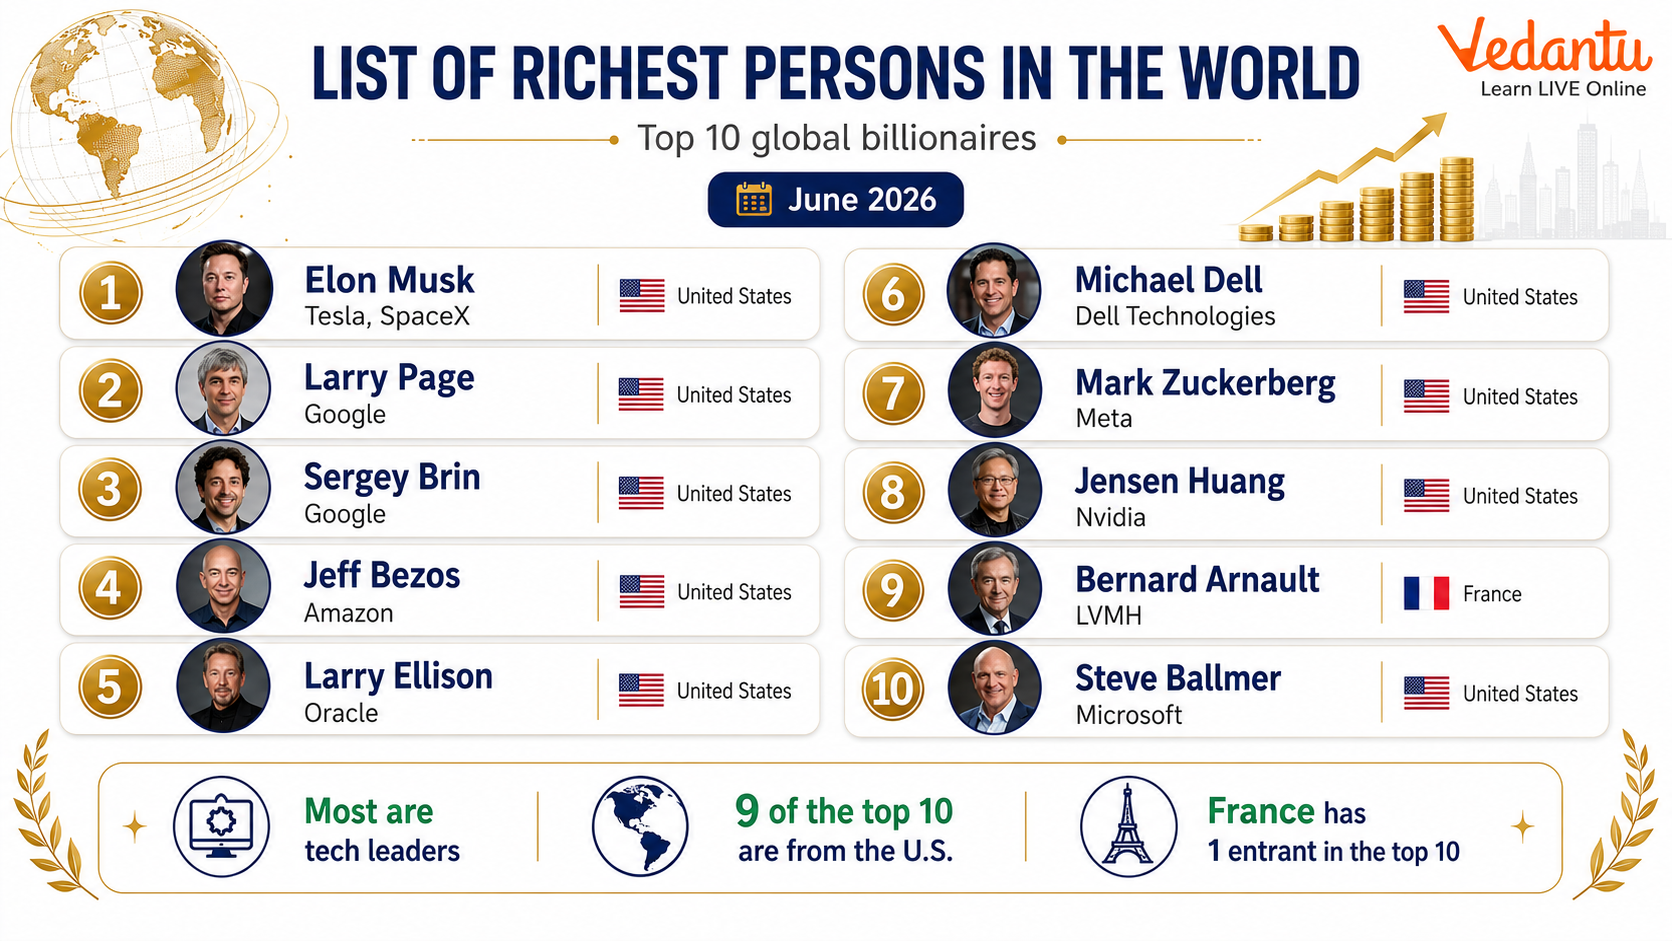
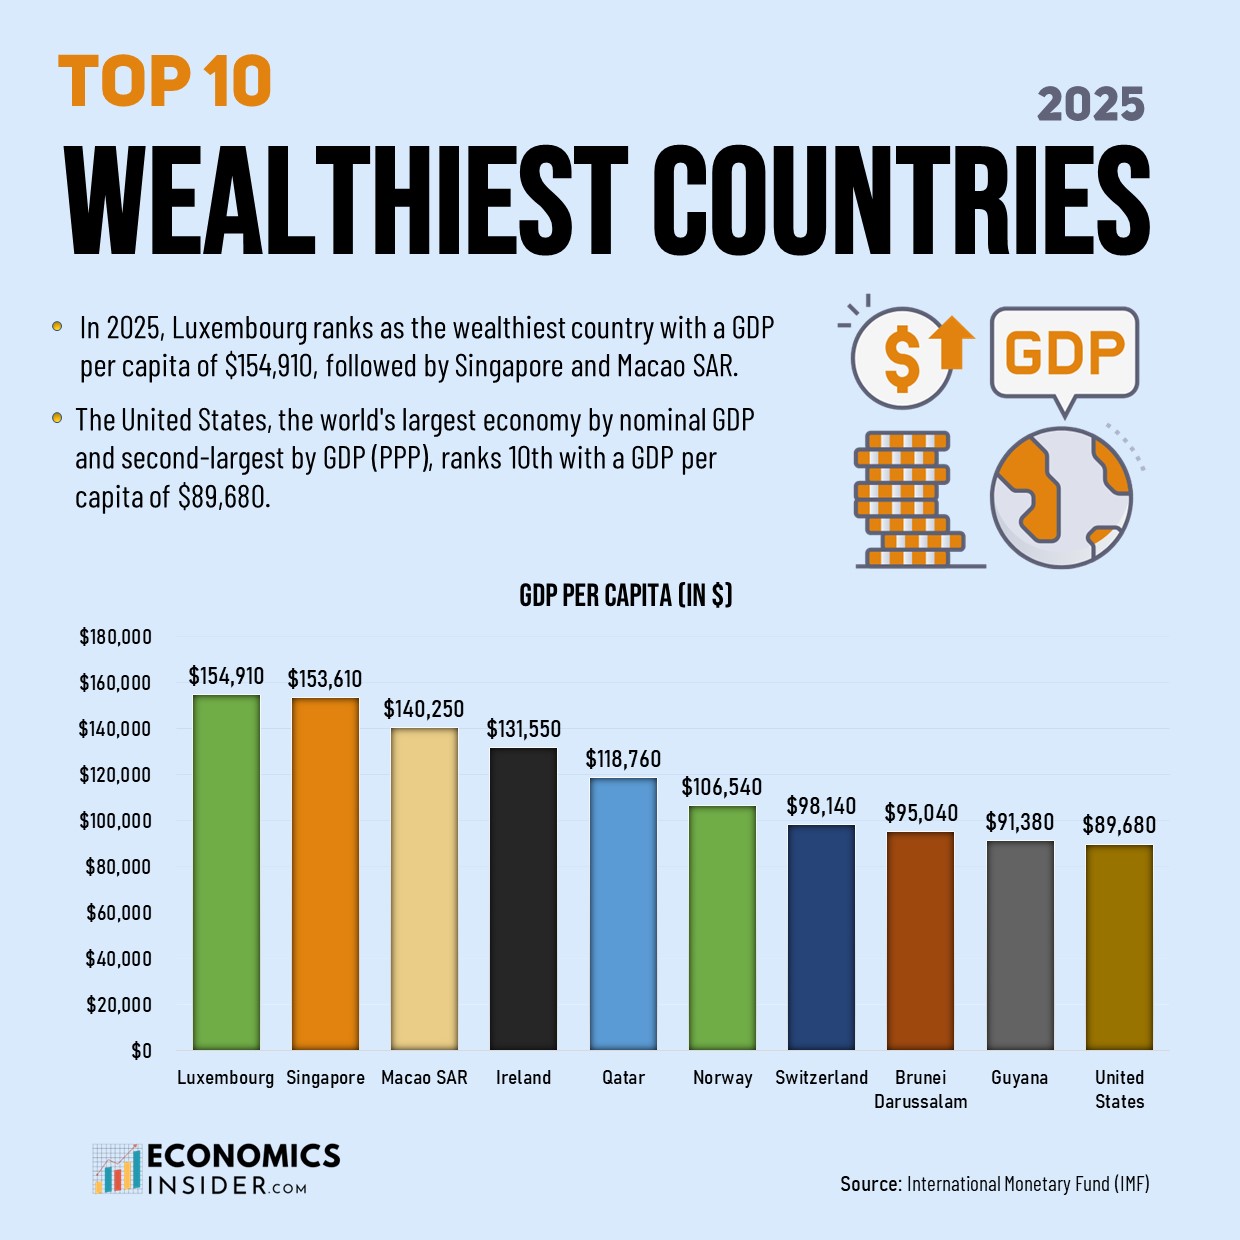
The 2025 net worth rankings reflect a year defined by significant fluctuations in global equity markets, the continued acceleration of artificial intelligence, and the consolidation of massive capital within the technology and retail sectors. As of early 2026, the individuals topping these lists are primarily characterized by their control of public companies, holding massive equity stakes in firms that have defined the current economic cycle.
The Mechanics of Net Worth Valuation
To understand the rankings of the world’s wealthiest individuals, one must first distinguish between "liquid wealth" and "net worth." For the individuals appearing at the top of 2025 wealth trackers, net worth is rarely a measure of cash held in bank accounts. Instead, it is an estimate derived from the current market value of their assets—most notably, their ownership stakes in publicly traded companies, private holdings, real estate, and art collections, minus their reported liabilities.
The valuations utilized by major financial publications are based on the closing stock prices of public companies and estimated multipliers for private holdings. Because these valuations are tethered to the stock market, an individual’s net worth can fluctuate by billions of dollars in a single trading session. This volatility explains why rankings often shift throughout the year; a 5% gain or loss in the share price of a core company like Tesla, Amazon, or LVMH can alter an individual's rank by several positions.
Major Economic Drivers in 2025
The 2025 fiscal year was heavily influenced by three core sectors: Artificial Intelligence (AI), luxury consumer goods, and cloud computing infrastructure.
- Artificial Intelligence Infrastructure: Companies focused on Large Language Models (LLMs), high-performance computing hardware, and energy infrastructure for data centers saw unprecedented valuation growth. The demand for specialized chips drove the market capitalization of semiconductor firms to historic highs, directly boosting the wealth of major stakeholders.
- Global Luxury Markets: Despite macroeconomic uncertainty, top-tier luxury conglomerates maintained strong profit margins through pricing power and brand prestige. The wealth of individuals associated with high-end retail is often more resilient to consumer spending dips than that of lower-tier retail moguls.
- Cloud and Enterprise Software: The migration of enterprise workloads to the cloud remained a dominant trend. The founders and major shareholders of the primary cloud providers saw their net worths buoyed by stable, recurring revenue streams that institutional investors rewarded with high price-to-earnings multiples.
Comparative Analysis of Leading Wealth Entities
When evaluating the richest individuals, it is helpful to categorize them by the nature of their primary holdings. The following table provides a high-level overview of the types of corporations that currently underpin the top of the wealth rankings.
| Category | Primary Industry | Asset Type | Valuation Sensitivity |
|---|---|---|---|
| Tech Innovators | Software & AI | Equity Stakes | High (Volatility based on R&D success) |
| Luxury Conglomerates | Consumer Goods | Brand & Holdings | Moderate (Global economic health) |
| Industrial Magnates | Energy & Infrastructure | Physical Assets | Low-Moderate (Commodity cycle) |
| Retail Giants | Logistics & E-commerce | Distribution Networks | Moderate (Consumer discretionary) |
Disambiguation: Historical Accuracy vs. Real-Time Fluctuations
It is critical to note that the data for 2025 represents a fixed historical record of that fiscal year. As we operate in 2026, many of the figures calculated at the end of the 2025 calendar year have already been eclipsed by subsequent market performance. When viewing rankings, users should look for the specific "as of" date provided by the source. Financial publications like Forbes or Bloomberg usually conduct comprehensive annual audits for their "Billionaires List," but these represent a snapshot in time.
If you are using these rankings for professional research or financial analysis, ensure you are referencing the specific audited reports from 2025 rather than mid-year estimates or speculative blog posts. Official proxies, such as Schedule 13D filings with the U.S. Securities and Exchange Commission (SEC), offer the most reliable data regarding the actual equity ownership percentages of individuals in U.S.-listed public companies.
The Role of Diversification in Wealth Retention
A common pattern among the wealthiest individuals is the transition from a "single-source" founder to a diversified portfolio holder. Many individuals who reached the top of the list in 2025 started with one core company—often a technology startup or a retail venture—but have since utilized vehicles such as family offices and private investment firms to diversify into aerospace, renewable energy, and media.
Diversification serves as a buffer against market shocks. When an individual’s wealth is tied entirely to a single stock, their net worth is essentially a leverage play on that company’s performance. By diversifying, these individuals move toward a "conglomerate model" of personal wealth, where capital is recycled into new ventures, thus mitigating the risk that the failure of one business segment will wipe out their total net worth.
Frequently Asked Questions
How is a person’s net worth calculated for these rankings? Calculators usually aggregate the current market value of all known assets (stocks, real estate, cash, private companies) and subtract verified debt. For public companies, the calculation is straightforward (shares owned multiplied by current share price). Private assets are valued using peer comparisons and revenue-to-valuation multiples.
Why do rankings change so rapidly throughout the year? The rankings change primarily because the underlying stock markets are dynamic. Because the vast majority of the wealth for these individuals is held in the form of equity, a movement of a few percentage points in a company’s share price can result in a shift of several billion dollars, often triggering a change in the leaderboard.
Are private assets included in these net worth rankings? Yes, reputable rankers attempt to include private assets, such as private equity stakes, real estate holdings, and private businesses. However, these are estimates based on available data and may not be as precise as public company valuations.
Where can I find the most accurate verification of these rankings? The most accurate sources are regulatory filings, such as the SEC’s Edgar database for U.S. companies. Financial journalism outlets like Bloomberg (via the Billionaires Index) and Forbes provide consolidated, aggregated views that analyze these filings alongside other market data.
Does tax impact the net worth figures provided in rankings? Typically, these rankings provide "gross" net worth—the total value of assets owned. They generally do not account for the potential capital gains taxes that would be owed if the individual were to liquidate those assets, nor do they factor in charitable giving that has already been executed, which would reduce the total amount of assets held.
Strategic Considerations for Investors
For those analyzing these rankings to understand market trends, the primary takeaway is the outsized influence of scale. The individuals in the 2025 top rankings own companies that have achieved "network effects" or "moats" that are nearly impossible to replicate.
When observing the companies associated with these figures, look for indicators of reinvestment. The wealthiest individuals are rarely those who have simply accumulated cash; they are those who have successfully reinvested their profits into new, high-growth sectors. If you are conducting research on these companies, prioritize reading the "Management Discussion and Analysis" (MD&A) sections of their annual reports. These sections provide the official narrative on why the company is performing well and where the leadership team expects to allocate capital in the upcoming cycles.
If your objective is to track wealth as a proxy for industry health, focus on the top 10 list, as the concentration of wealth in the hands of a few often signals that the underlying sector—be it cloud computing or AI—is in a period of heavy institutional adoption and capital expenditure. Always ensure that the data you are reviewing is cross-referenced with official regulatory disclosures to avoid relying on outdated or speculative estimates.