To rank in the top 50% of U.S. households in 2019, you needed a net worth of approximately $121,700. To enter the top 10%, the threshold rose to roughly $1.22 million, while the top 1% required a minimum net worth of approximately $11.1 million. These figures reflect the financial landscape immediately preceding the global pandemic.
Understanding your net worth rank for 2019 provides a vital baseline for assessing long-term wealth accumulation. Because net worth is a lagging indicator of financial health—representing the sum of all assets minus all liabilities—the 2019 data from the Federal Reserve's Survey of Consumer Finances (SCF) remains the most authoritative "pre-crisis" benchmark. As we navigate the economic environment of 2026, looking back at these specific percentiles allows individuals to see how much of their current wealth is due to organic saving versus the aggressive asset price inflation seen in the early 2020s.
The Architecture of Wealth in 2019
The 2019 financial year was characterized by a decade-long bull market in equities and a steady, if not explosive, recovery in the housing market. These factors created a significant divide between those who owned appreciating assets and those who relied solely on labor income. Net worth is calculated by taking the market value of everything you own (home, retirement accounts, brokerage accounts, vehicles, and cash) and subtracting everything you owe (mortgages, student loans, credit card debt, and auto loans).
In 2019, the "average" American household was a tale of two statistics: the mean and the median. The mean net worth was significantly higher at approximately $748,800, skewed upward by the extreme wealth of the top 0.1%. However, the median net worth—the point at which half of households have more and half have less—was $121,700. This $627,100 gap illustrates the high level of wealth concentration that existed just before the turn of the decade.
Why 2019 Serves as a Critical Benchmark
For many households, 2019 represented the last year of "normal" economic predictability. By evaluating where you stood then, you can better understand your financial trajectory. If your net worth was in the 50th percentile in 2019 and has since moved to the 70th percentile by 2026, you have successfully outpaced the broader economic shifts, including the high inflation periods of 2021–2023.
Furthermore, the 2019 data is essential because it was the last major data set before the Federal Reserve adjusted interest rates to near-zero levels, which artificially inflated asset prices. Comparing your 2019 rank to your current standing helps filter out the "noise" of market volatility and focuses on your disciplined savings and debt reduction efforts.
2019 Net Worth Percentile Thresholds
To see where you stacked up, you must look at the specific cutoffs for various percentiles. These numbers represent the minimum net worth required to enter that specific tier of American wealth.
| Percentile | 2019 Net Worth Threshold (Approx.) | Wealth Category Description |
|---|---|---|
| Top 1% | $11,100,000 | Ultra-High Net Worth (UHNW) |
| Top 5% | $2,580,000 | High Net Worth / Accredited Investors |
| Top 10% | $1,220,000 | The "Millionaire" Class |
| Top 25% | $403,000 | Upper Middle Class / Established Professionals |
| Top 50% | $121,700 | The Median American Household |
| Top 75% | $12,400 | Lower Middle Class / Asset Poor |
| Bottom 25% | < $12,400 | Net Debt or Zero Asset Households |
Analyzing the Top Tiers (1% to 10%)
The jump from the top 10% to the top 1% in 2019 was massive—nearly a tenfold increase. This indicates that while many "mass affluent" households achieved millionaire status through home equity and 401(k) contributions, the top 1% were largely defined by business ownership, significant private equity holdings, or massive brokerage portfolios. In 2019, entering the top 10% ($1.22M) was achievable for many dual-income professional households nearing retirement. However, the $11.1M barrier for the 1% remained largely out of reach for those relying solely on a W-2 salary.
The Middle Class Reality (25% to 50%)
The 50th percentile mark of $121,700 in 2019 highlights the importance of homeownership. For the majority of households in this bracket, the equity in their primary residence was their single largest asset. If you had a net worth of $400,000 in 2019, you were doing better than three-quarters of the country. This group typically had a mix of home equity, modest retirement savings, and manageable consumer debt.
The Impact of Age on Net Worth Ranking
Comparing a 25-year-old’s net worth to the national median is often misleading. Wealth is naturally cumulative; it grows through compound interest and career progression while debt—particularly student loans—is gradually paid down. To truly see where you stacked up in 2019, you must view the data through the lens of age cohorts.
Younger Households (Under 35)
In 2019, the median net worth for households headed by someone under 35 was approximately $13,900. At this stage of life, many individuals are in the "negative net worth" phase due to student loans. If you had a positive net worth of $50,000 at age 30 in 2019, you were significantly ahead of your peers, likely ranking in the top 25% for your age group.
The Peak Earning Years (45–64)
The highest median net worths in 2019 were found in the 55–64 age bracket, where the median reached $212,500. This makes sense as these individuals have had decades to benefit from home appreciation and employer-sponsored retirement matches. To be in the top 10% of this age group in 2019, you needed a net worth exceeding $1.5 million.
Retirement Age (65+)
For those 65 and older, the median net worth in 2019 was $266,400. Interestingly, the median begins to decline slightly in the 75+ age bracket as retirees begin to "decumulate" or spend down their assets to fund their lifestyle and healthcare costs.
Primary Drivers of Net Worth in 2019
Several factors dictated whether a household moved up or down the rankings in 2019. Understanding these drivers helps explain why the wealth gap was so pronounced.
Homeownership
In 2019, the median net worth of homeowners was $255,000, while the median net worth of renters was just $6,300. This 40:1 ratio emphasizes that, for the vast majority of Americans, the "forced savings" mechanism of a mortgage was the primary engine of wealth creation. Renters in 2019 faced the double-edged sword of rising rents and the inability to capture the appreciation of the real estate market.
Education Levels
There was a direct correlation between educational attainment and 2019 net worth. Households headed by a person with a college degree had a median net worth of $308,100, compared to just $22,700 for those with only a high school diploma. While the "cost-to-value" ratio of degrees is often debated in 2026, the 2019 data clearly shows that higher education was a robust predictor of asset accumulation.
Business Ownership
Business equity accounted for a massive portion of the wealth in the top 1% and 5%. While the average American's wealth was tied to their home, the wealthiest households in 2019 owned private companies or had significant "angel" investments. Business owners often have a lower median net worth in their early years due to reinvestment, but they dominate the higher percentiles in later life.
How to Calculate Your 2019 Net Worth Retroactively
If you are looking back from the year 2026 and want to see where you stacked up in 2019, you can perform a "financial archaeology" exercise. Follow these steps to reconstruct your 2019 balance sheet:
- Identify 2019 Assets: Log into your primary bank or brokerage accounts and search for statements dated December 31, 2019. Look for the "Ending Balance." Don't forget to include the estimated value of your home at that time (tools like historical Zillow data can assist here).
- Identify 2019 Liabilities: Look for your mortgage balance, student loan statements, and credit card balances from the end of 2019.
- The Calculation: Total Assets - Total Liabilities = 2019 Net Worth.
- Adjust for Context: Compare this number to the percentile table above.
When performing this look-back, be sure to use nominal dollars (the actual dollars you had in 2019) rather than adjusting for 2026 inflation, as the Federal Reserve benchmarks are presented in the dollars of that specific survey year.
Common Pitfalls in Net Worth Benchmarking
While ranking yourself can be a helpful diagnostic tool, it is important to avoid common errors that can skew your perception of your financial health.
- Ignoring Cost of Living: A net worth of $500,000 in 2019 went much further in the Midwest than in San Francisco or New York City. The national rankings do not account for regional purchasing power.
- The "Lifestyle Creep" Trap: Some households have a high net worth but very low liquidity. If your wealth is entirely in a home you never plan to sell, your "rank" may feel higher than your actual day-to-day financial flexibility suggests.
- Overlooking Debt Quality: Not all debt is created equal. A $300,000 mortgage at 3% interest (common in 2019) is "better" debt than $20,000 in credit card debt at 20% interest, even if the total liability on the balance sheet is higher.
Frequently Asked Questions
What was considered a "good" net worth in 2019?
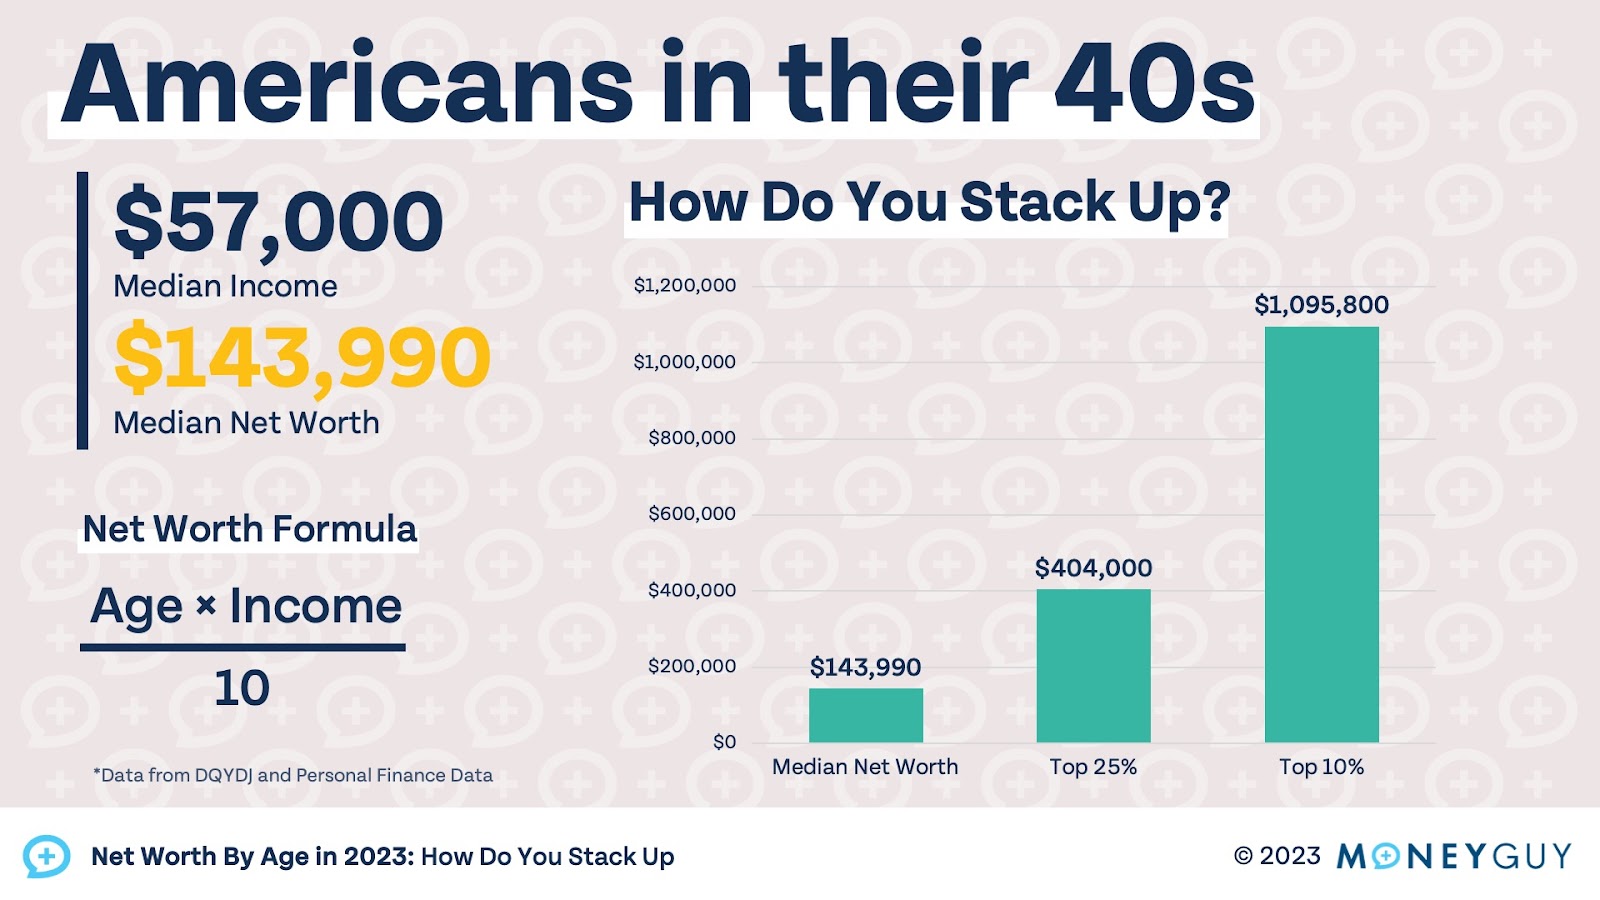
A "good" net worth is subjective and depends on age and location. However, statistically, having a net worth above the median of $121,700 put you in the top half of the country. For a household in their 40s, a net worth of $400,000 was generally considered a strong benchmark for being on track for a comfortable retirement.
How much did the top 1% earn in 2019?
It is important to distinguish between income and net worth. While the top 1% of net worth required $11.1 million, the top 1% of annual income in 2019 started at approximately $540,000. Many people with high incomes have low net worths due to high spending, and many people with high net worths (like retirees) have relatively low annual incomes.
Does net worth include the value of my cars?
Yes, technically net worth includes all "use assets," such as vehicles, furniture, and jewelry. However, for a more conservative view of your financial health, many experts recommend calculating "Investable Net Worth," which excludes your primary residence and personal property, focusing instead on cash, stocks, and bonds.
Why does the Federal Reserve only release this data every three years?
The Survey of Consumer Finances is an incredibly deep and complex undertaking that involves detailed interviews with thousands of households. The 2019 survey was released in late 2020. The subsequent survey (2022) was released in 2023. As of 2026, we are looking forward to the release of the 2025 survey data to see how the landscape has shifted since the pandemic.
Did the 2019 net worth rank include 401(k) and IRA accounts?
Yes, the Federal Reserve includes all "quasi-liquid" retirement accounts in their net worth calculations. These are considered some of the most important assets for the middle and upper-middle-class brackets (the 50th to 90th percentiles).
Next Steps for Improving Your Rank
Seeing where you stacked up in 2019 is the first step toward a more intentional financial future in 2026 and beyond. If you found that your 2019 rank was lower than you expected, focus on the two primary levers of wealth: increasing the gap between your income and expenses, and moving your savings into appreciating assets.
The data from 2019 shows that those who owned businesses and real estate significantly outperformed those who did not. In the current 2026 environment, where interest rates and market conditions have evolved, the principle remains the same: wealth is built by owning a piece of the economy, not just participating in it as a consumer. Review your current 2026 balance sheet, compare it to your 2019 archaeology, and ensure your "Net Worth Velocity"—the speed at which your wealth grows—is moving in the right direction.