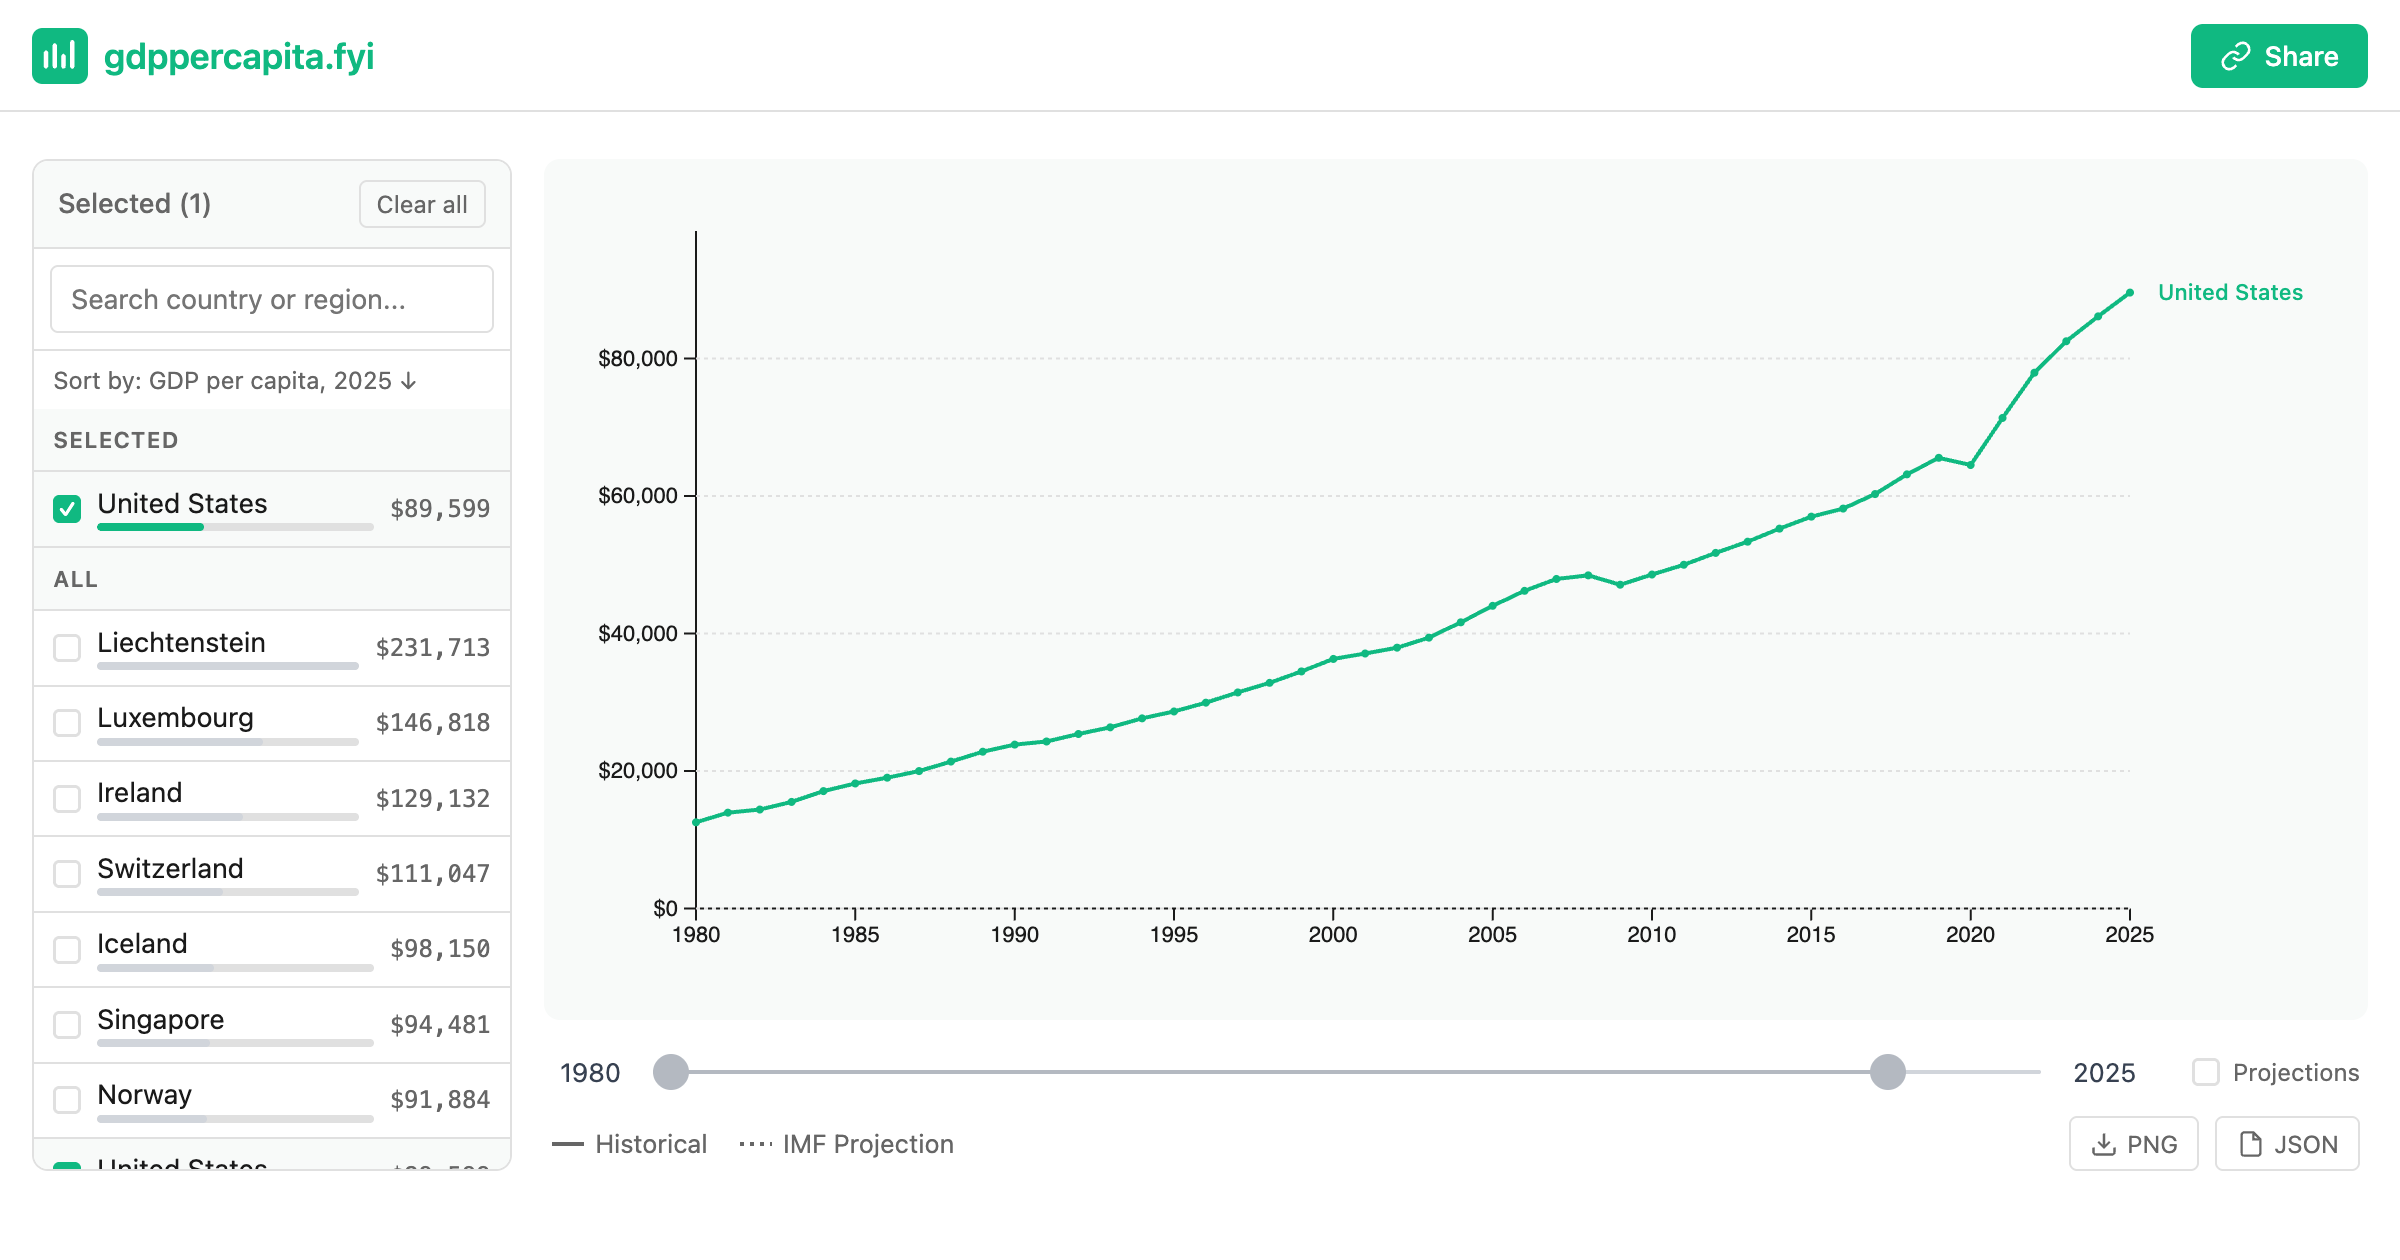
Evaluating the economic standing of the United States requires looking beyond standard markers like Gross Domestic Product to encompass environmental economics, asset depreciation, and comprehensive wealth metrics. Traditional economic indicators often obscure long-term stability by ignoring ecological degradation and resource depletion. Recent statistical frameworks developed by federal agencies offer a clearer perspective, tying human-made output directly to natural net worth and per capita wealth distribution.
Understanding the Intersections of Economic Output and Natural Capital
For decades, standard macroeconomic analysis relied heavily on Gross Domestic Product (GDP) to measure national progress. While GDP effectively tracks the total market value of goods and services produced within a country during a specific period, it possesses a notable blind spot. It treats the consumption of natural resources, such as timber, minerals, and fossil fuels, as pure economic gain while ignoring the depletion of the underlying asset base.
To address this limitation, economic researchers and federal statisticians utilize the concept of natural capital. Natural capital represents the world's stocks of natural assets, which include geology, soil, air, water, and all living things. When these assets are integrated with traditional economic metrics, analysts can construct a more accurate picture of national wealth. This approach recognizes that a nation's true prosperity depends not only on industrial machinery, real estate, and financial assets, but also on the health and availability of its ecosystems.
In the United States, federal data collection agencies, notably the Bureau of Economic Analysis (BEA) in coordination with the Office of Management and Budget and the U.S. Geological Survey, have worked to formalize these environmental-economic accounts. By calculating natural net worth alongside GDP per capita, policymakers gain insight into whether economic growth is sustainable or if it relies on drawing down foundational environmental wealth.
Macroeconomic Overview of United States GDP Per Capita
Gross Domestic Product per capita divides a nation's total economic output by its total population, providing a standardized metric to compare living standards across different regions and time periods. In the context of the United States, GDP per capita has historically ranked among the highest for major advanced economies, driven by high productivity, technological innovation, deep capital markets, and a resilient consumer base.
However, standard GDP per capita figures do not reveal how income and wealth are distributed among the populace, nor do they account for the environmental costs incurred to generate that output. Two economies might post identical GDP per capita figures, yet one might achieve its output through sustainable technological efficiency while the other achieves it by rapidly depleting non-renewable resources and degrading water and air quality.
To contextualize raw economic output, analysts pair GDP per capita with comprehensive wealth accounting. Comprehensive wealth measures the total value of a nation's assets, broken down into three primary categories:
- Produced Capital: Infrastructure, structures, machinery, and residential and commercial real estate.
- Human Capital: The present value of future earnings of the workforce, determined by education, skills, and experience.
- Natural Capital: Land, timber, fossil fuels, minerals, and ecosystem services that provide clean air, water, and climate regulation.
Evaluating these components highlights how the United States sustains its high GDP per capita. While human and produced capital comprise the vast majority of total wealth in advanced economies, natural capital underpins agricultural productivity, energy independence, and climate resilience.
| Asset Category | Primary Components | Contribution to U.S. Wealth | Measurement Challenges |
|---|---|---|---|
| Human Capital | Workforce education, skills, health, future earnings potential | Dominant share of total comprehensive wealth | Valued using lifetime earnings models; subject to demographic shifts |
| Produced Capital | Commercial buildings, residential housing, machinery, infrastructure | Substantial foundation for daily economic activity | Dependent on depreciation rates and replacement costs |
| Natural Capital | Subsurface mineral assets, timber, agricultural land, ecosystems | Critical baseline for energy, food, and environmental health | Hard to price non-market ecosystem services like pollination and carbon sequestration |
The Evolution of Natural Capital Accounting in Federal Data
Integrating environmental data into national accounts represents a major shift in economic measurement. Historically, environmental assets were treated as free and limitless inputs to production. The publication of official environmental-economic accounts by the BEA marks a structural change in how the federal government measures national worth.
These accounts track specific ecosystem services and asset values. For example, the BEA's experimental land and ecosystem accounts measure the physical extent and economic value of different land cover types, including forests, wetlands, croplands, and urban areas. By assigning value to these landscapes, economists can track changes in natural net worth over time.
Natural net worth specifically looks at the total value of a nation's natural resource stocks minus depletion. When a barrel of oil is extracted or a forest is harvested, the physical asset is reduced. Traditional GDP records the market transaction of the extraction, but natural capital accounts record the simultaneous depreciation of the natural asset. If the depreciation of natural capital exceeds investment in other forms of wealth, total national wealth declines, even if annual GDP shows positive growth.
Key Drivers of U.S. Natural Resource Valuation
The valuation of natural assets in the United States depends heavily on market prices, extraction rates, and technological advancements. Several distinct resource sectors drive the calculation of natural net worth:
Energy and Subsurface Minerals
Subsurface assets—including crude oil, natural gas, coal, and metallic and non-metallic minerals—constitute a major portion of measured natural capital. Technological shifts, such as hydraulic fracturing and horizontal drilling, significantly altered the valuation of U.S. energy reserves over the past two decades. Increased domestic production expanded the measured value of subsoil assets, demonstrating how technology can redefine resource scarcity.
Agricultural and Forest Land
Agricultural soils and commercial timberlands represent foundational renewable natural assets. The valuation of these assets depends on commodity prices, soil health, and sustainable management practices. Federal programs administered by the U.S. Department of Agriculture (USDA) provide extensive data on land use changes, crop yields, and conservation easements, which feed directly into comprehensive wealth calculations.
Ecosystem Services and Non-Market Valuation
Assigning economic value to non-market ecosystem services remains a complex task for statisticians. Services such as flood mitigation by wetlands, carbon sequestration by forests, and pollination by wild insects do not pass through traditional markets with explicit price tags. Economists use specialized valuation methods, such as replacement cost and contingent valuation, to estimate the economic contribution of these ecological functions to the broader economy.
Comparative Analysis of Economic Metrics
To fully understand how GDP per capita interacts with natural net worth, it is helpful to contrast traditional macroeconomic indicators with comprehensive wealth frameworks.
| Metric | Primary Focus | What It Measures | Limitations |
|---|---|---|---|
| Gross Domestic Product (GDP) | Flow of economic activity | Total market value of final goods and services produced | Ignores income distribution, environmental degradation, and resource depletion |
| GDP Per Capita | Average economic output per person | Standardized economic output divided by population size | Fails to capture wealth inequality or the sustainability of growth |
| Natural Net Worth | Stock of environmental assets | Total value of natural resources and ecosystems minus depletion | Relies on complex estimation models for non-market ecosystem services |
| Comprehensive Wealth | Total national balance sheet | Combined value of produced, human, and natural capital | Requires continuous adjustments for asset price volatility and technological change |
Frequently Asked Questions
What is the primary difference between GDP per capita and natural net worth?
GDP per capita measures the annual economic output generated per person within a country, focusing on the flow of goods and services. Natural net worth measures the total stock of environmental assets and natural resources owned by a nation, adjusted for depletion. While GDP per capita tracks immediate economic productivity, natural net worth evaluates long-term ecological and asset sustainability.
Why do economists look beyond GDP when assessing national prosperity?
GDP measures market activity rather than true human well-being or economic sustainability. An economy can experience high GDP growth while simultaneously depleting its natural resources, degrading environmental quality, or increasing wealth inequality. Comprehensive wealth and natural capital accounting provide a balance sheet approach to ensure current consumption does not compromise future economic stability.
How are ecosystem services valued in federal economic data?
Valuing ecosystem services involves specialized economic techniques since these services often lack direct market prices. Statisticians estimate values by examining the cost of replacing natural services with human-made infrastructure, analyzing property value differentials near natural amenities, or using modeled estimates of the economic damages avoided through ecological protection, such as flood reduction by wetlands.
Does the United States have a positive or negative trajectory in natural net worth?
The trajectory of U.S. natural net worth varies by asset class. While technological efficiencies and conservation efforts have improved management in certain sectors, subsoil asset values fluctuate heavily with global commodity markets, and land use changes continue to place pressure on specific ecosystems. Official BEA and federal statistical reports provide ongoing updates on these asset balances.
Practical Next Steps for Researchers and Analysts
For economists, policymakers, and researchers seeking to utilize the latest data on U.S. economic output and natural wealth:
- Consult Official Federal Portals: Access the Bureau of Economic Analysis (BEA) interactive data tables for integrated environmental-economic accounts and land valuation metrics.
- Review USGS and USDA Databases: Examine raw physical stock data from the U.S. Geological Survey and the Department of Agriculture to cross-reference resource extraction and land use changes.
- Incorporate Comprehensive Wealth Frameworks: When modeling long-term economic forecasts, combine standard GDP per capita projections with balance sheet assets, including human and natural capital indices, to account for structural sustainability risks.