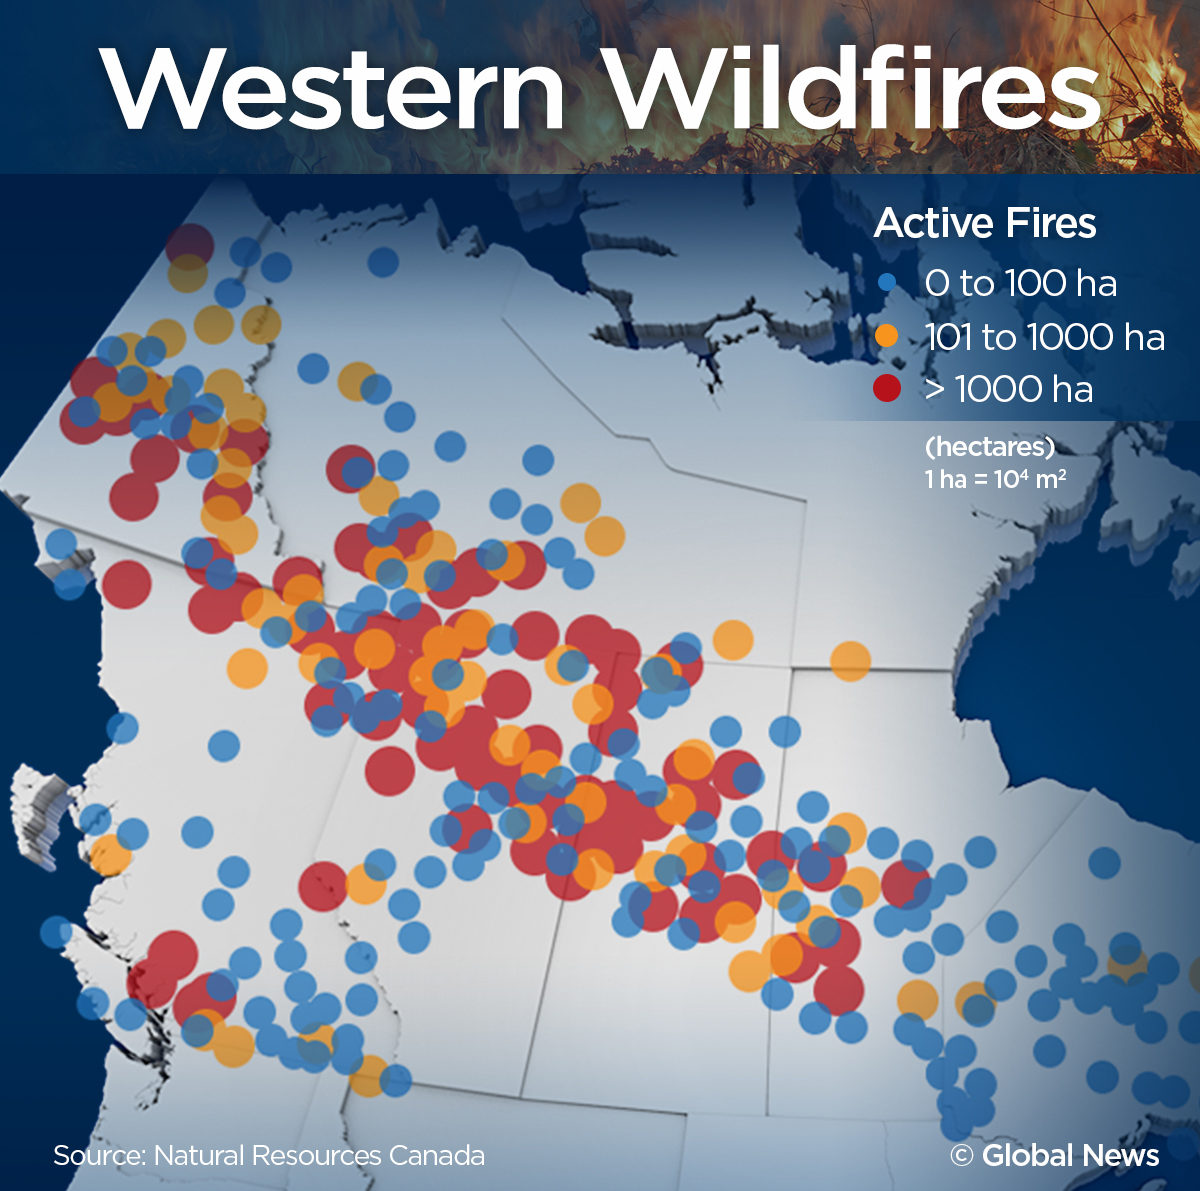
The 2023 Canadian wildfire season was the most destructive in the country’s recorded history, consuming over 18.5 million hectares of land. This catastrophic event surpassed all previous records for area burned, carbon emissions, and evacuation orders. By analyzing infographic maps and finalized data reports, we can understand the unprecedented scale and long-term ecological consequences of this historic crisis.
The Scale of the 2023 Wildfire Season: A Statistical Overview
When looking back from our current vantage point in 2026, the 2023 wildfire season remains the definitive benchmark for extreme fire behavior in North America. To put the 18.5 million hectares into perspective, the area burned was roughly equivalent to the size of North Dakota or the entire country of Syria. This was not merely a "bad year"; it was a statistical outlier that doubled the previous record set in 1989.
The Canadian Interagency Forest Fire Centre (CIFFC) and Natural Resources Canada (NRCan) have since finalized the data, confirming that nearly 5% of Canada’s entire forest area was affected. Unlike typical years where fire activity is concentrated in specific regions like British Columbia or Alberta, 2023 saw simultaneous, high-intensity blazes across nearly every province and territory. This "pan-Canadian" crisis stretched national resources to their breaking point, necessitating the deployment of thousands of international firefighters from countries including South Africa, Australia, New Zealand, France, and the United States.
The infographic maps generated during the peak of the crisis, particularly in June and July 2023, revealed a startling density of "out of control" fires. These maps used color-coded markers—typically red for out of control, yellow for being held, and blue for under control—to illustrate the volatility of the situation. At the height of the season, the map of Northern Quebec and the Northwest Territories was almost entirely obscured by red icons, signifying a landscape-scale emergency that local suppression efforts could not contain.
Mapping the Geographical Impact: Regional Breakdowns
The 2023 season was characterized by its geographic diversity. While the West is traditionally prone to fire, the intensity seen in Eastern Canada, particularly Quebec and Nova Scotia, caught many off guard and reshaped how we visualize fire risk maps today.
Quebec and the Atlantic Provinces
Quebec experienced an unprecedented start to its fire season in early June 2023. A series of dry lightning strikes ignited hundreds of fires in a matter of days. Infographic maps from that period show a massive concentration of fires in the Jamésie and Côte-Nord regions. The sheer volume of smoke produced by these fires was responsible for the historic "Orange Skies" seen over New York City. In Nova Scotia, the Tantallon fire became the largest wildfire in the province’s history, forcing the evacuation of thousands near Halifax and highlighting the vulnerability of the wildland-urban interface (WUI) even in humid maritime climates.
The Northwest Territories and the Yellowknife Evacuation
Perhaps the most dramatic visual from the 2023 maps was the encroachment of fire toward Yellowknife. In August, the capital of the Northwest Territories faced a direct threat from a massive complex of fires. Satellite imagery and infographic maps tracked the fire’s progress as it moved within 15 kilometers of the city. This led to the successful but harrowing evacuation of approximately 20,000 residents—nearly the entire population. The maps of this region illustrate a "burn mosaic" that remains visible from space today, showing how fire skipped across the subarctic landscape.
British Columbia and Alberta
Western Canada continued its trend of severe fire seasons, though 2023 was particularly relentless. In British Columbia, the Donnie Creek fire became the largest individual wildfire in the province's history, burning over 570,000 hectares—an area larger than Prince Edward Island. Alberta faced an early start in May, with heatwaves and drought creating "tinderbox" conditions that resulted in widespread property loss in communities like Drayton Valley and Fox Lake.
Visualizing Smoke and Atmospheric Emissions
One of the most shared infographics of 2023 was the "Smoke Plume Map." Unlike ground-based fire maps, these visualizations tracked the vertical and horizontal movement of particulate matter (PM2.5) across the globe. By mid-summer, Canadian smoke had crossed the Atlantic Ocean, reaching as far as Norway and Spain.
Data from the Copernicus Atmosphere Monitoring Service (CAMS) later revealed that the 2023 fires released approximately 473 megatonnes of carbon. This figure is nearly three times the previous Canadian record for annual fire emissions. For context, these emissions were greater than the annual fossil fuel emissions of many large industrialized nations. Infographics illustrating this data often use "carbon footprint" comparisons to show that the 2023 wildfires effectively neutralized many of the carbon reduction gains made through climate policy in other sectors.
The health impacts visualized in these maps were equally stark. Air Quality Index (AQI) maps frequently hit "Hazardous" levels (300+) in cities like Ottawa, Toronto, Detroit, and New York. These visualizations served as a vital public health tool, providing real-time data that guided school closures and outdoor activity cancellations for millions of people.
Meteorological Drivers: Why 2023 Was Different
To understand the 2023 Canadian wildfires, one must look at the meteorological infographics detailing the "Omega Block" weather patterns and extreme drought codes. The primary driver was a prolonged period of record-breaking heat combined with significantly below-average precipitation across the boreal forest belt.
Meteorologists use the "Drought Code" (DC), a component of the Canadian Forest Fire Weather Index (FWI) System, to measure the moisture content of deep, compact organic layers. In 2023, DC values in many parts of Canada reached levels never seen before. This meant that even if surface fires were extinguished, the fire continued to smolder deep in the ground, making it nearly impossible to fully suppress without significant, sustained rainfall.
Furthermore, an "Omega Block"—a high-pressure system sandwiched between two low-pressure systems—became stationary over Canada for weeks. This atmospheric configuration acted like a dome, trapping hot air and preventing moisture from entering the region. Infographic animations of this weather pattern show how the jet stream was diverted, leaving the forest floor to desiccate under intense solar radiation.
Socio-Economic Consequences and Recovery Data
The 2023 fires were not just an environmental disaster; they were a significant economic shock. While the total insured losses were calculated in the billions, the indirect costs—including lost timber revenue, health care expenses related to smoke inhalation, and the cost of massive evacuation efforts—were much higher.
| Metric | 2023 Season Totals (Finalized) | Historical Annual Average (Pre-2023) |
|---|---|---|
| Total Hectares Burned | ~18.5 Million | ~2.5 Million |
| Number of Fires | 6,623 | ~5,500 |
| Total Carbon Emissions | 473 Megatonnes | ~150 Megatonnes |
| Evacuees | Over 230,000 | ~15,000 |
| International Personnel | 5,500+ from 12 countries | ~500 |
| Structure Losses | 1,000+ | Variable |
The recovery process, which we continue to monitor in 2026, has focused on reforestation and the implementation of "FireSmart" principles. Data maps of replanting efforts show a shift toward "deciduous breaks"—planting broadleaf trees like aspen and birch, which are naturally more fire-resistant than coniferous species like spruce and pine. This strategy aims to create a more resilient forest mosaic that can slow the spread of future mega-fires.
Looking Forward: Lessons and Policy Changes
The "Latest News" in 2026 regarding the 2023 fires involves the long-term health studies being released. Researchers are now publishing findings on the respiratory and cardiovascular effects on populations exposed to the 2023 smoke. These studies utilize the very infographic maps created during the crisis to correlate smoke density with hospital admission rates, providing a clearer picture of the "invisible" toll of wildfires.
Technologically, the 2023 season accelerated the development of satellite-based fire detection. The WildFireSat mission, Canada's first purpose-built satellite system for monitoring wildfires, received increased funding and priority following the 2023 disaster. In 2026, we now have access to near-real-time infrared data that allows for fire detection within minutes of ignition, a direct result of the lessons learned when traditional aerial reconnaissance was grounded by heavy smoke in 2023.
Policy-makers have also moved toward a "co-existence" model. Recognizing that total fire suppression is impossible in a changing climate, there is now more emphasis on prescribed burns and indigenous-led cultural burning. Maps of modern forest management now include these "managed fire" zones, which aim to reduce the fuel load that fueled the 2023 infernos.
Frequently Asked Questions
What was the main cause of the 2023 Canadian wildfires?
The primary cause was a combination of extreme drought and record-breaking temperatures across Canada, which made the vegetation highly flammable. While lightning strikes ignited many of the remote fires (particularly in Quebec and the NWT), human activity was responsible for many starts in more populated areas. The severity was amplified by climate change, which has increased the frequency and duration of the "fire weather" conditions seen in 2023.
How did the 2023 fires affect air quality in the United States?
The fires produced massive amounts of smoke that were carried south by prevailing winds. In June 2023, cities like New York, Philadelphia, and Washington D.C. experienced some of the worst air quality in the world. Infographic maps from NASA and the EPA showed a "smoke corridor" stretching from the Canadian boreal forest deep into the American South. This event highlighted that wildfire smoke is a transboundary health issue that requires international cooperation.
Are the forests that burned in 2023 regrowing?
Yes, the boreal forest is a fire-adapted ecosystem. By 2026, many of the areas burned in 2023 are showing signs of regeneration. Species like the jack pine rely on the heat of fire to open their serotinous cones and release seeds. However, in areas where the fire was so intense that it consumed the soil's organic layer, recovery is much slower. Conservationists are monitoring these "high-severity" patches closely to ensure that invasive species do not take hold before native trees can return.
How much did the 2023 wildfire season cost Canada?
While a final, all-encompassing figure is difficult to calculate, estimates suggest the total economic impact exceeded $20 billion CAD. This includes direct firefighting costs, insured property damage, lost revenue from the forestry and tourism sectors, and the massive healthcare costs associated with smoke-related illnesses. The scale of the loss prompted a significant increase in federal funding for the National Adaptation Strategy.
Where can I find the most accurate 2023 wildfire infographic maps today?
The most accurate historical maps are maintained by Natural Resources Canada through the Canadian Wildland Fire Information System (CWFIS). Additionally, the Canadian Interagency Forest Fire Centre (CIFFC) provides archived daily situation reports and maps. For atmospheric data, the Copernicus Atmosphere Monitoring Service (CAMS) offers detailed visualizations of the 2023 smoke and carbon emissions.
Practical Recommendation for Disaster Preparedness
Given the increasing frequency of extreme fire seasons, it is essential for residents in or near forested areas to take proactive steps. Review the "FireSmart Canada" guidelines to reduce the risk to your property. This includes maintaining a 1.5-meter non-combustible zone around your home, clearing debris from gutters, and choosing fire-resistant plants for landscaping. Furthermore, always have an emergency "go-bag" ready and stay informed through official government alert apps, as the 2023 season proved that fires can move faster than traditional communication channels can often keep up with.