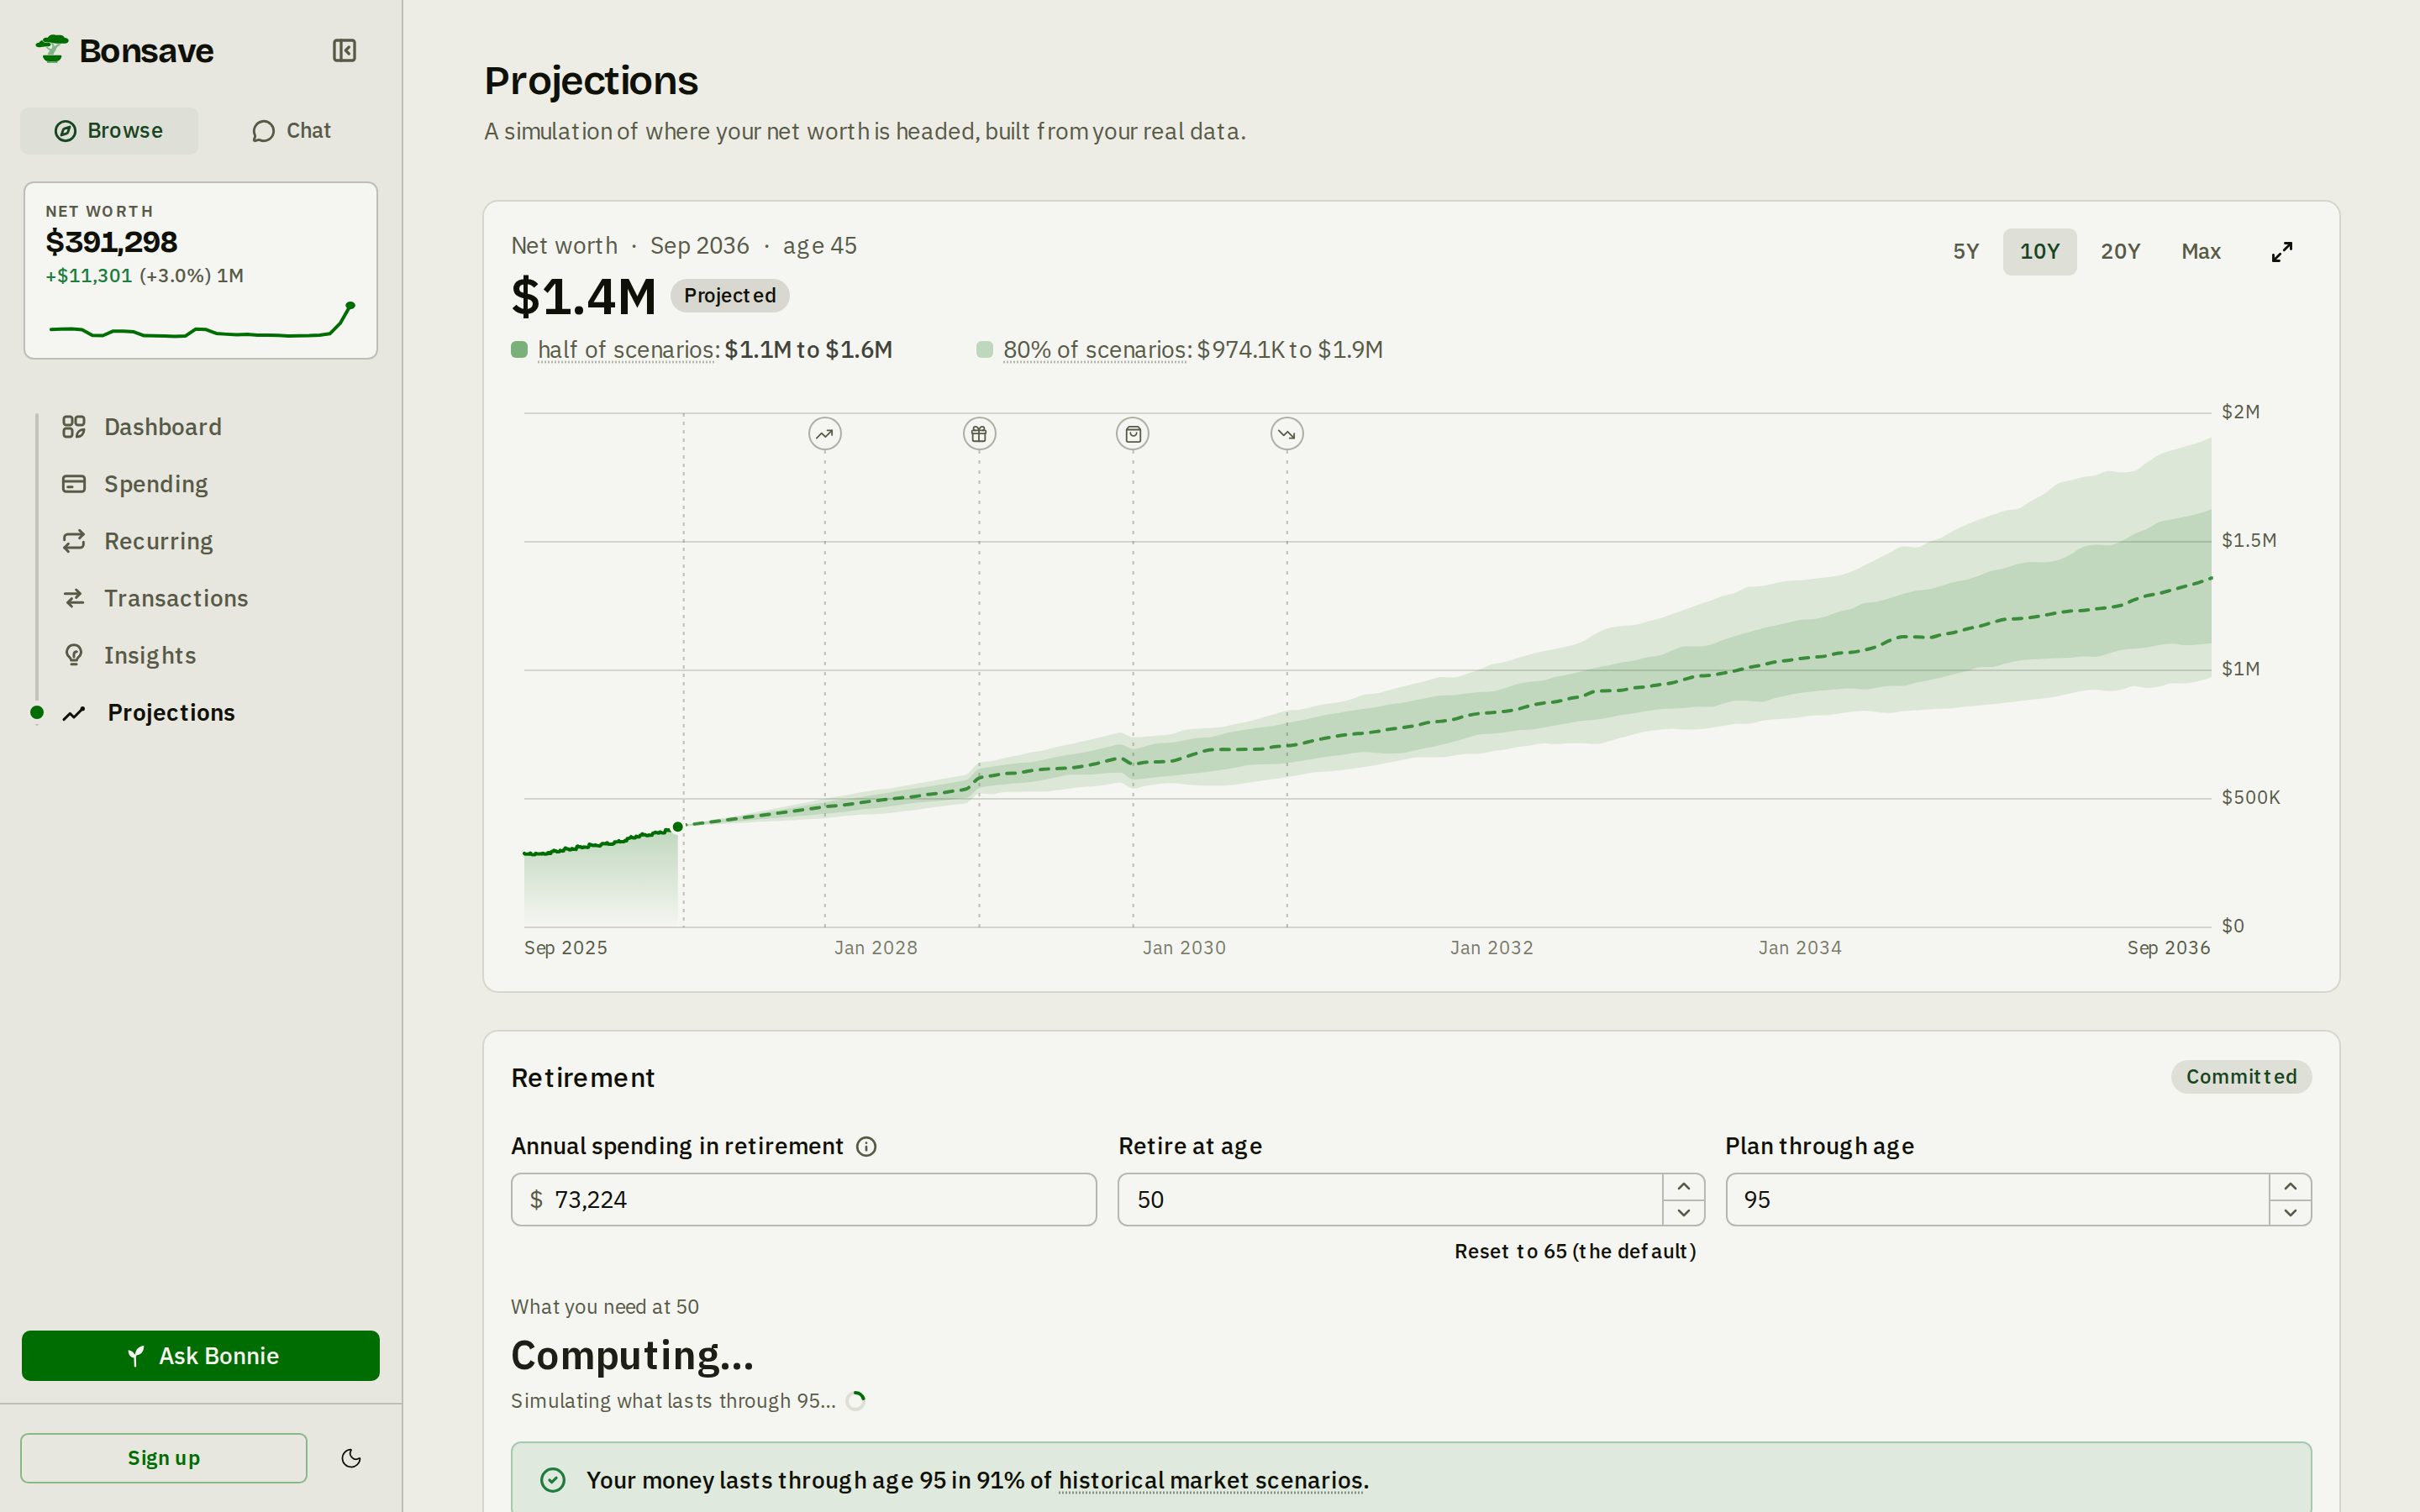
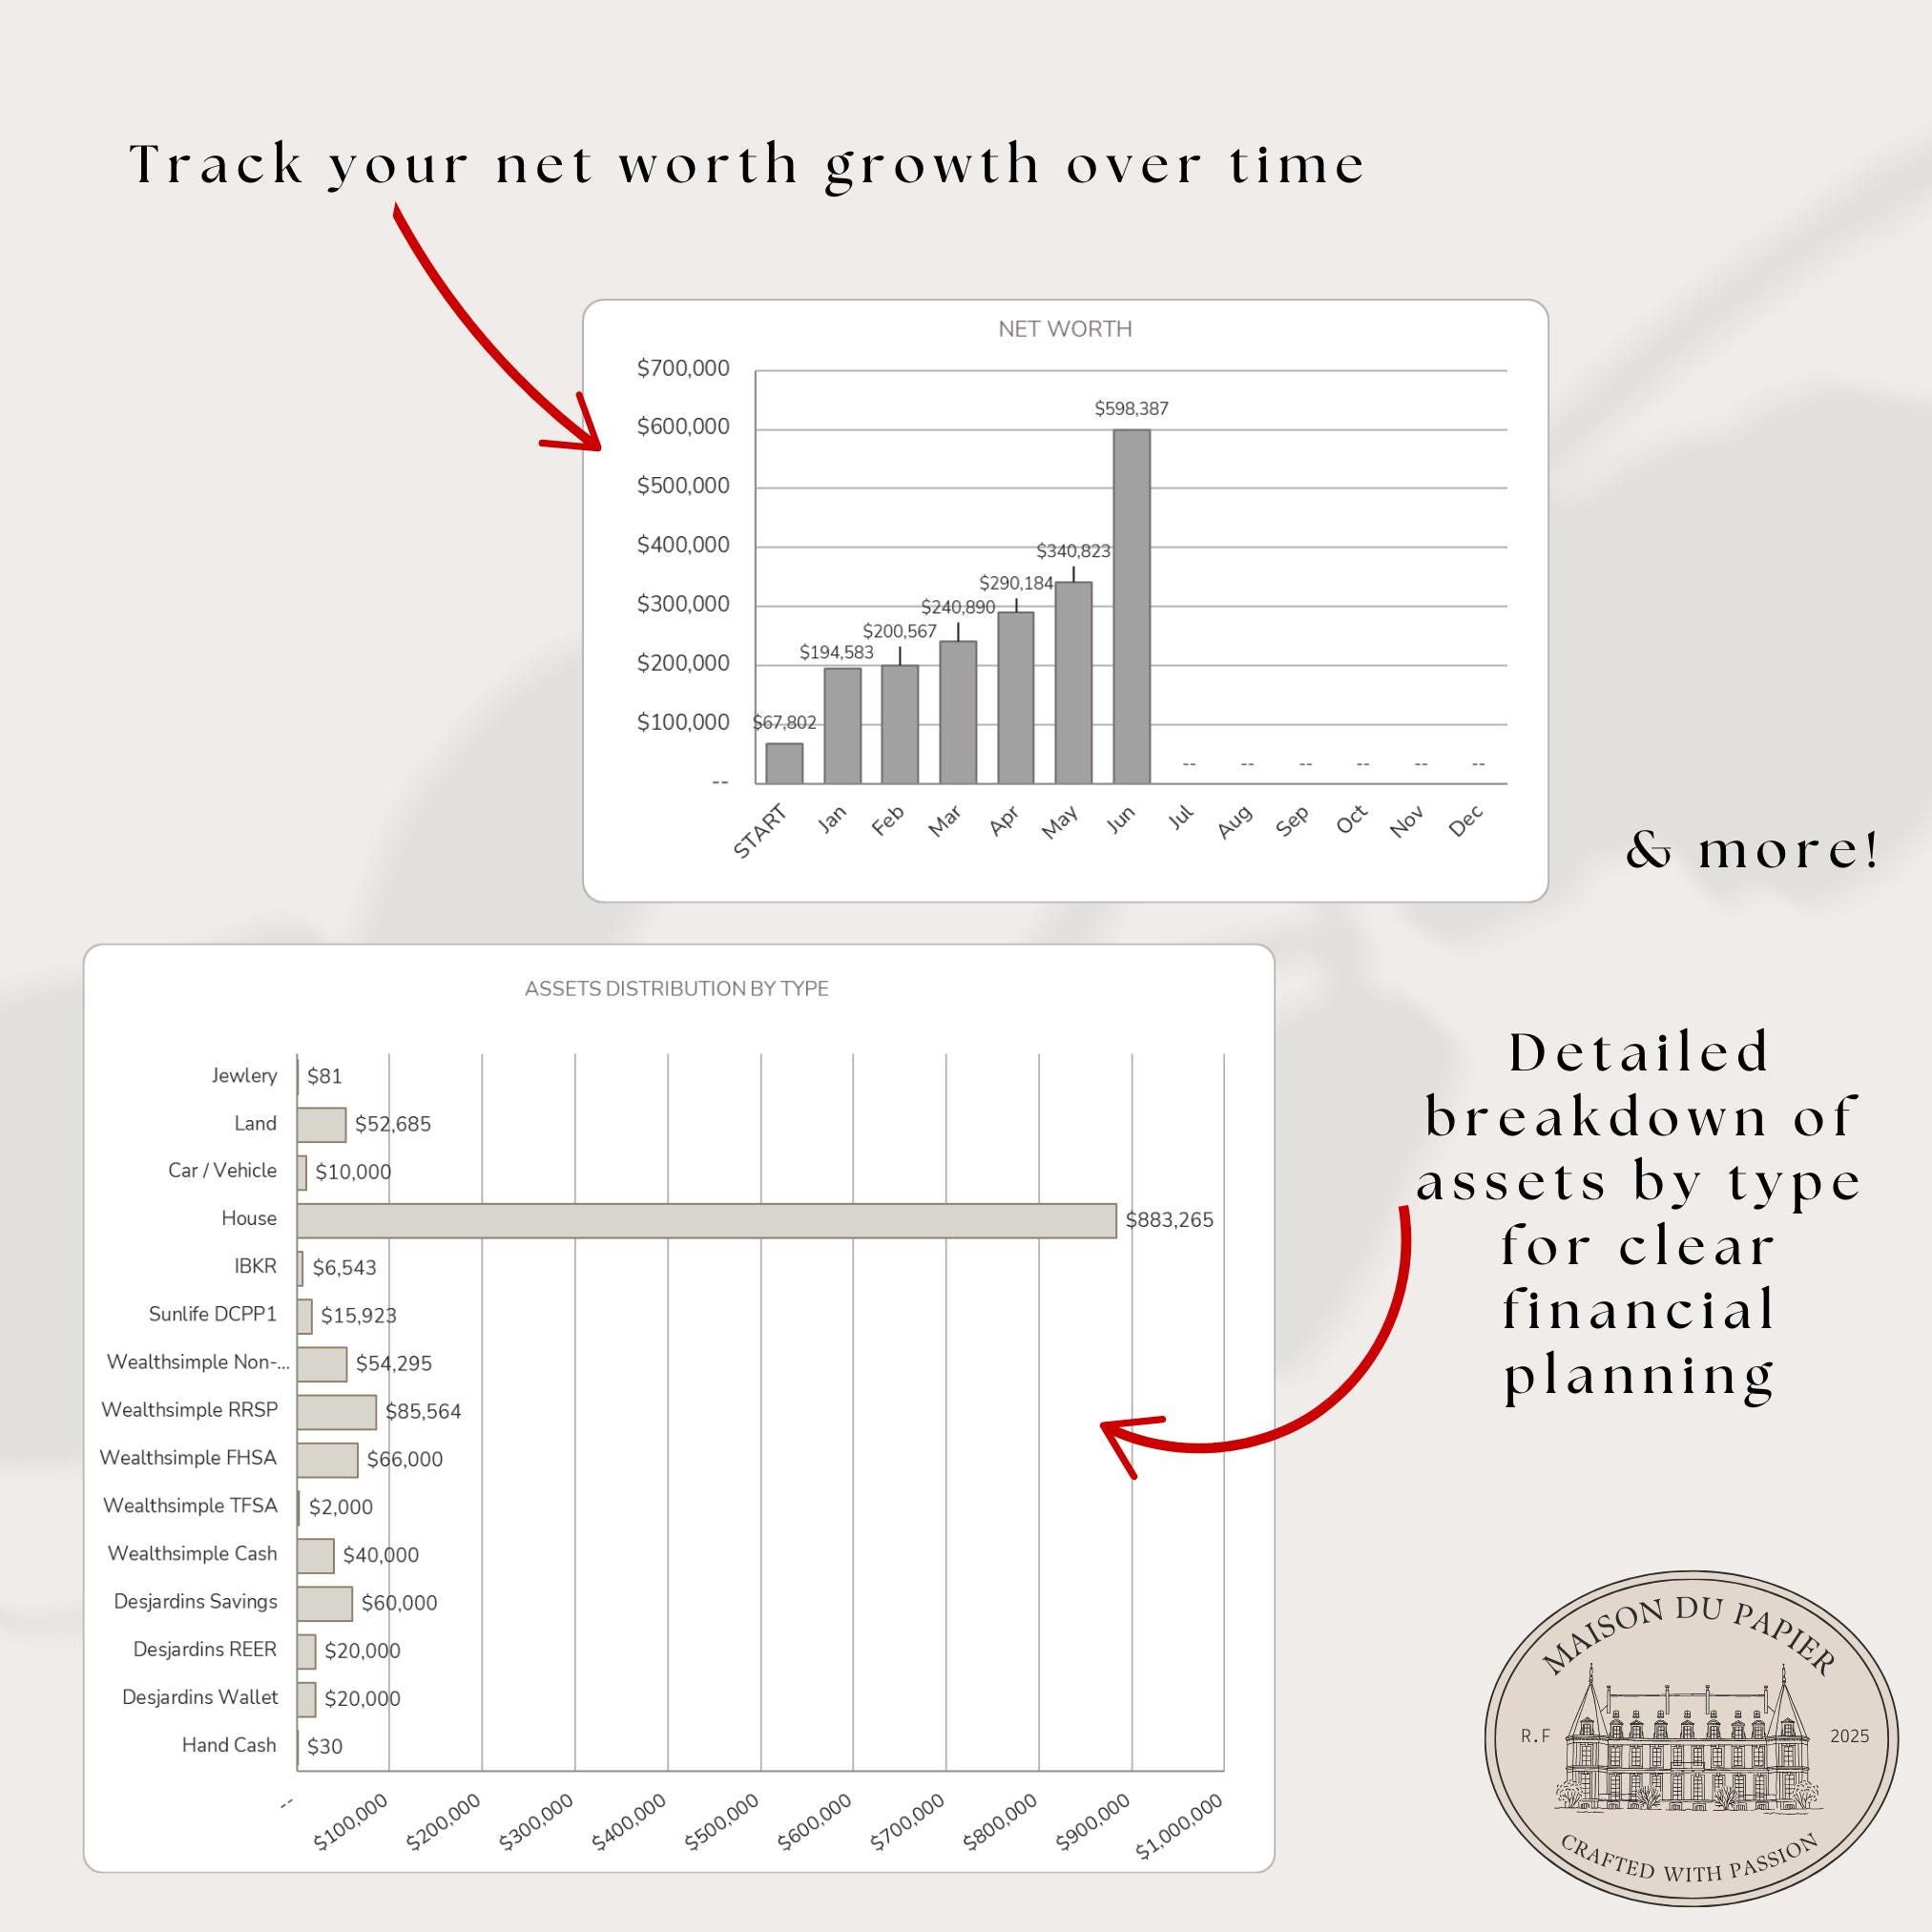
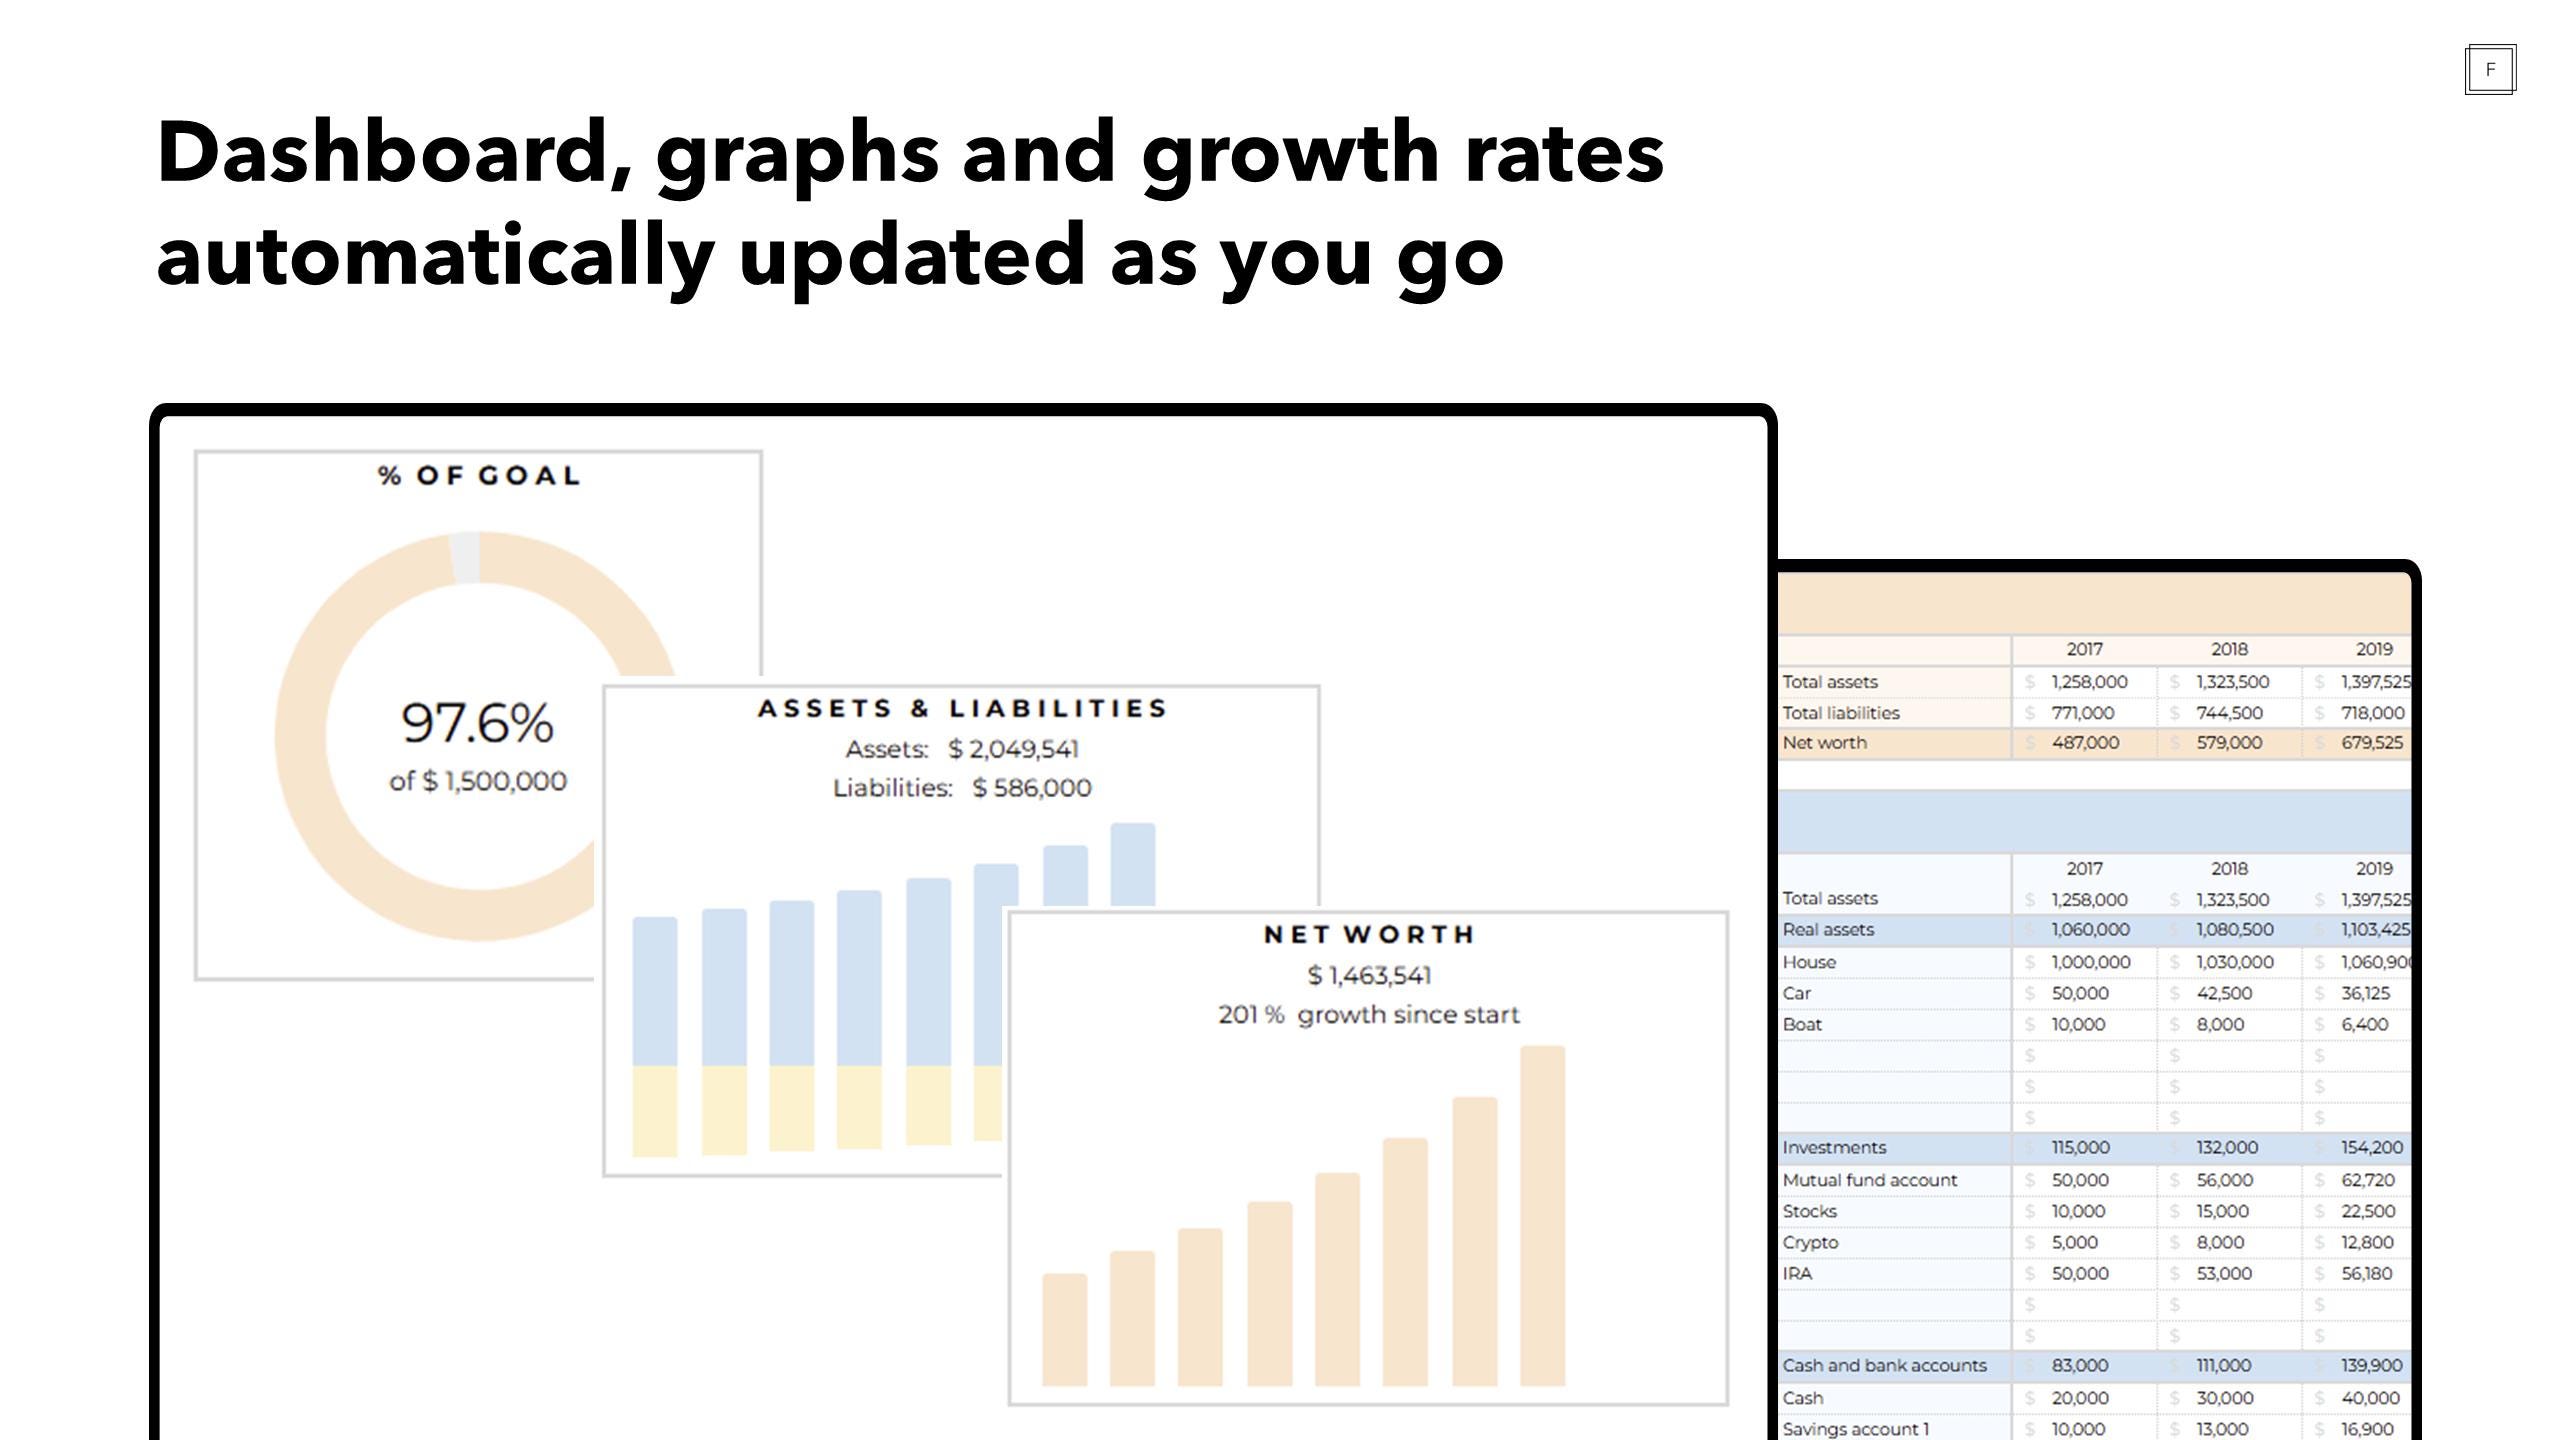
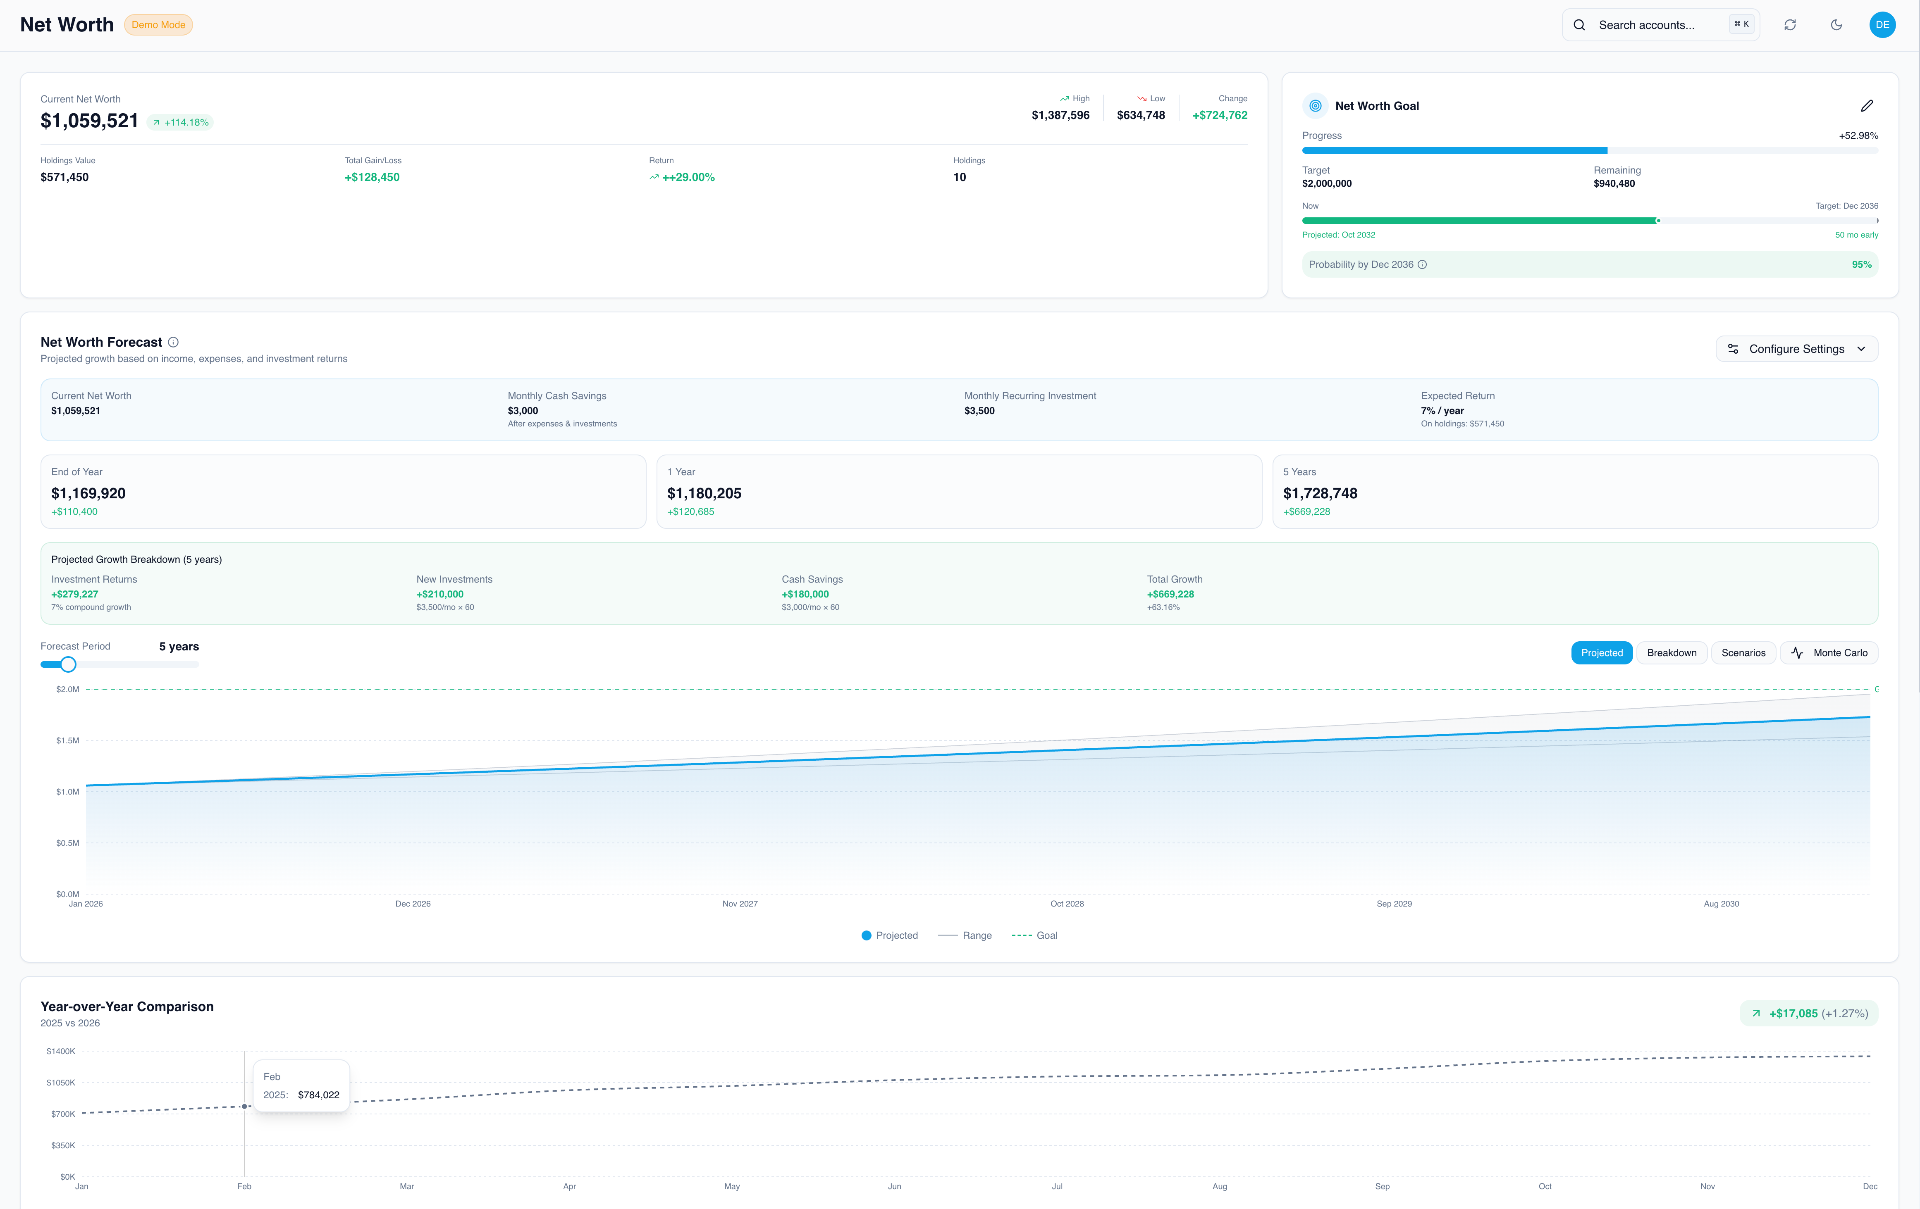
A 3D net worth graph is an immersive financial visualization tool that plots your assets, liabilities, and overall wealth across three spatial dimensions over time. By transforming traditional two-dimensional spreadsheets into interactive multidimensional landscapes, it helps investors identify macro trends, evaluate portfolio allocations, and maintain long-term financial engagement.
Understanding the Evolution of Net Worth Tracking
For decades, individuals have tracked their financial progress using basic notebooks, static spreadsheets, or rigid desktop accounting applications. While columns of numbers and flat line graphs accurately display mathematical growth, they often fail to capture the psychological engagement required for long-term wealth building. A flat line rising steadily toward the top right corner of a monitor can feel disconnected from reality, reducing years of disciplined saving, compounding interest, and market volatility into an abstract data point.
The introduction of multidimensional financial visualization bridges the gap between raw data and psychological motivation. By leveraging computer graphics, spatial mapping, and interactive design, a 3D net worth graph transforms dry balance sheets into living, breathing landscapes. Assets can be represented as rising towers, liabilities as plunging canyons, and cash flow as dynamic rivers moving through a virtual terrain. This shift from tabular data to spatial awareness allows you to interact with your personal economy in a visceral way, making abstract milestones feel tangible and immediate.
Furthermore, modern wealth tracking demands more than simple balance calculations. High-net-worth individuals, tech-savvy professionals, and everyday investors manage complex portfolios spanning traditional equities, real estate, private equity, cryptocurrencies, and alternative assets. A traditional two-dimensional line chart struggles to display multiple asset classes simultaneously without becoming a chaotic web of overlapping markers. Third-dimensional plotting introduces depth, height, and lateral axes, allowing you to visualize asset correlation, risk exposure, and liquidity distribution all within a single unified workspace.
Core Concepts Behind Multidimensional Wealth Visualization
To build or utilize an effective 3D net worth graph, you must first understand the underlying geometry and data structures that govern financial spatial modeling. Unlike basic graphing software that plots $X$ and $Y$ coordinates, a three-dimensional environment incorporates an additional axis, typically designated as $Z$, to represent depth, time, or categorical variance.
In the context of wealth management, each axis serves a distinct analytical purpose:
- The X-Axis (Time Horizon): Represents chronological progression, moving from past financial milestones through the current month up to projected future retirement dates.
- The Y-Axis (Net Worth Magnitude): Denotes monetary value, scaling from negative debt territories up to multi-million-dollar asset valuations.
- The Z-Axis (Asset Categorization or Risk): Introduces a secondary variable, such as asset class distribution, liquidity levels, or inflation-adjusted purchasing power, giving spatial depth to the graph.
By plotting data points across these three coordinates, your financial history transforms into a topographical surface. A sudden spike in equity markets appears as a sharp geological elevation, while a major debt acquisition, such as a mortgage or business loan, carves out a depression in the terrain. This multidimensional approach prevents the common pitfall of viewing net worth as a single monolithic number, encouraging you to analyze the underlying structural integrity of your balance sheet.
| Axis Designation | Standard Financial Metric | Analytical Purpose |
|---|---|---|
| X-Axis | Chronological Timeline (Months/Years) | Tracks growth trajectories and long-term momentum over decades. |
| Y-Axis | Total Valuation (Assets Minus Liabilities) | Measures absolute wealth magnitude and baseline financial health. |
| Z-Axis | Asset Class / Liquidity / Risk Profile | Illustrates portfolio diversification and structural composition. |
Data Architecture and Prerequisites
Before generating any spatial wealth visualization, you must establish a clean, accurate, and regularly updated financial dataset. A 3D graph is only as reliable as the data fed into its rendering engine. Garbage input will inevitably produce misleading visual outputs that can distort your financial planning.
The foundational prerequisite is a complete balance sheet audit. You must compile every active financial account, categorize them strictly, and establish a standardized update cadence. This data preparation phase involves several distinct steps:
- Asset Aggregation: Catalog all liquid cash accounts, checking reserves, brokerage portfolios, retirement accounts (such as 401ks, IRAs, or pensions), real estate holdings, vehicles, and valuable personal property.
- Liability Consolidation: Document all outstanding debts, including mortgage balances, student loans, auto financing, credit card liabilities, and personal loans.
- Valuation Standardization: Convert all foreign currencies into your base operating currency using historical exchange rates for past entries and real-time feeds for current valuations.
- Frequency Synchronization: Ensure all data entries align on a consistent timeline, typically monthly or quarterly, to prevent spatial distortions caused by irregular data intervals.
Once your data is cleaned and formatted into structured formats such as CSV (Comma-Separated Values) or JSON, it becomes compatible with advanced charting libraries, custom programming environments, or specialized fintech visualization tools capable of rendering 3D graphics.
Building Your 3D Net Worth Graph: Approaches and Tools
Depending on your technical expertise and privacy preferences, you can construct or access a 3D net worth graph using several distinct pathways. Each method offers unique advantages regarding customization, security, and ease of use.
Custom Scripting with Python and WebGL
For individuals with programming experience, Python remains the premier language for financial data processing, while WebGL or JavaScript libraries like Three.js provide the rendering engine for interactive 3D environments.
Using Python libraries such as pandas for data manipulation and plotly or matplotlib for 3D surface plotting, you can generate interactive HTML-based graphs that render directly in your browser. Below is a conceptual overview of how developers structure such scripts:
import pandas as pd import plotly.graph_objects as go # Load historical balance sheet data data = pd.read_csv('net_worth_history.csv') # Define spatial coordinates x_time = data['Date'] y_wealth = data['NetWorth'] z_category = data['AssetClassIndex'] # Generate 3D surface plot fig = go.Figure(data=[go.Scatter3d( x=x_time, y=y_wealth, z=z_category, mode='lines+markers', marker=dict(size=5, color=y_wealth, colorscale='Viridis') )]) fig.update_layout(title='3D Net Worth Wealth Journey', scene=dict( xaxis_title='Timeline', yaxis_title='Net Worth ($)', zaxis_title='Asset Class')) fig.show()
This programmatic approach ensures absolute data privacy because your financial records never leave your local machine or trusted encrypted environment.
Dedicated Financial Visualization Platforms
If you prefer a plug-and-play solution without writing code, several advanced personal finance dashboards and spreadsheet add-ons incorporate multidimensional charting capabilities. While traditional budgeting apps like Mint (historically) or Rocket Money focus on 2D bar and line charts, modern power-user tools allow integration with data visualization suites like Microsoft Power BI or Tableau.
By linking your financial databases to these business intelligence platforms, you can construct customized 3D dashboards that update automatically via secure API connections to your banking institutions. This route requires careful consideration of data privacy policies, as third-party aggregators handle your financial credentials.
Interpreting Your Wealth Landscape
Once your 3D net worth graph is operational, learning to interpret the visual topography is critical for making informed financial decisions. The spatial layout reveals patterns that are easily missed in standard tabular summaries.
Identifying Growth Plateaus and Volatility Canyons
In a well-constructed 3D wealth graph, sustained periods of saving and compounding interest appear as steady, upward-sloping hills. Conversely, sudden market corrections, unexpected medical expenses, or major asset liquidations manifest as steep drop-offs or canyons in the terrain. By analyzing the frequency and depth of these valleys, you can evaluate your portfolio's resilience against economic shocks.
If your graph displays high volatility with jagged peaks and deep troughs, your asset allocation may be overly concentrated in high-risk equities or speculative assets. If the graph resembles a flat plateau over extended periods, it may indicate a lack of aggressive saving or insufficient exposure to growth-oriented investments, signaling that inflation is eroding your purchasing power.
Evaluating Asset Concentration Versus Diversification
When utilizing the Z-axis to represent asset classes—such as separating cash, equities, real estate, and alternative investments—the width and elevation of different terrain sections show your true diversification. A healthy wealth journey typically displays a balanced, multi-peaked landscape where no single asset class dominates the entire visual field. If your 3D model shows a single towering monolith representing one company stock or a single piece of real estate, your wealth is dangerously exposed to idiosyncratic risk.
Common Pitfalls and Limitations of 3D Financial Modeling
While 3D net worth graphs offer powerful psychological and analytical benefits, they also introduce specific challenges that users must navigate carefully.
- Visual Distortion and Scale Bias: Three-dimensional perspectives can distort proportions. A distant data point may appear smaller or less significant simply due to perspective rendering, leading to cognitive biases when evaluating past financial decisions.
- Over-Engineering and Analysis Paralysis: Spending excessive time tweaking visualization scripts, adjusting camera angles, and formatting color scales can distract from the fundamental work of earning, saving, and investing money. Visualization should serve wealth creation, not replace it.
- Security and Data Exposure: Uploading granular financial data to cloud-based graphing tools or poorly secured local scripts can expose sensitive net worth figures to cyber threats. Always prioritize end-to-end encryption and local execution when handling personal financial data.
- Illiquid Asset Valuation Flaws: Incorporating private equity, collectibles, or real estate estimates into a high-frequency 3D graph can create false impressions of liquidity. Because these assets cannot be instantly converted to cash, their daily or monthly fluctuations are often speculative guesses rather than realized market values.
Frequently Asked Questions
What is the primary benefit of using a 3D net worth graph over a standard 2D chart?
A 3D net worth graph allows you to visualize multiple financial variables simultaneously—such as time, total wealth magnitude, and asset class distribution—within an interactive spatial environment. This multidimensional view enhances psychological engagement and helps identify complex portfolio imbalances that flat charts obscure.
Do I need coding experience to create a 3D wealth tracking graph?
No. While developers can use Python, Three.js, or WebGL for complete customization, everyday users can build multidimensional dashboards using business intelligence tools like Microsoft Power BI or advanced spreadsheet templates connected to charting extensions.
How often should I update the data feeding my 3D financial graph?
Most financial planners recommend updating your comprehensive net worth balance sheet on a monthly or quarterly basis. Updating too frequently (such as daily) can introduce unnecessary anxiety caused by normal market volatility, while updating too infrequently reduces the accuracy of your long-term trend analysis.
Are cloud-based 3D financial visualization tools safe to use?
Safety depends entirely on the specific platform's security architecture. Always verify whether a platform utilizes end-to-end encryption, multi-factor authentication, and strict privacy policies that prohibit selling or analyzing your personal financial data. For maximum security, local execution via offline spreadsheets or custom scripts is recommended.
How should I account for volatile assets like cryptocurrency or real estate in my graph?
For real estate, use conservative appraisals or recent comparable market values, updating valuations quarterly or annually. For cryptocurrencies and volatile equities, you can sync automated price feeds or log closing balances at standardized monthly intervals to maintain visual consistency without overreacting to daily price swings.
Practical Next Actions for Your Wealth Journey
To begin integrating multidimensional visualization into your financial life without becoming overwhelmed, start with a phased approach:
- Audit and Clean Your Data: Spend your first session consolidating all active accounts, asset valuations, and liability totals into a single, standardized spreadsheet.
- Establish a Baseline 2D Model: Ensure your foundational math is correct and that you understand your monthly cash flow and net worth trajectory before introducing complex spatial dimensions.
- Choose Your Tooling: Select a platform that matches your technical skill level—whether that is a Python visualization script, an advanced business intelligence dashboard, or an interactive spreadsheet template.
- Schedule Regular Reviews: Set a recurring calendar reminder every month or quarter to update your data inputs, examine your wealth topography, and adjust your savings or investment strategies accordingly.