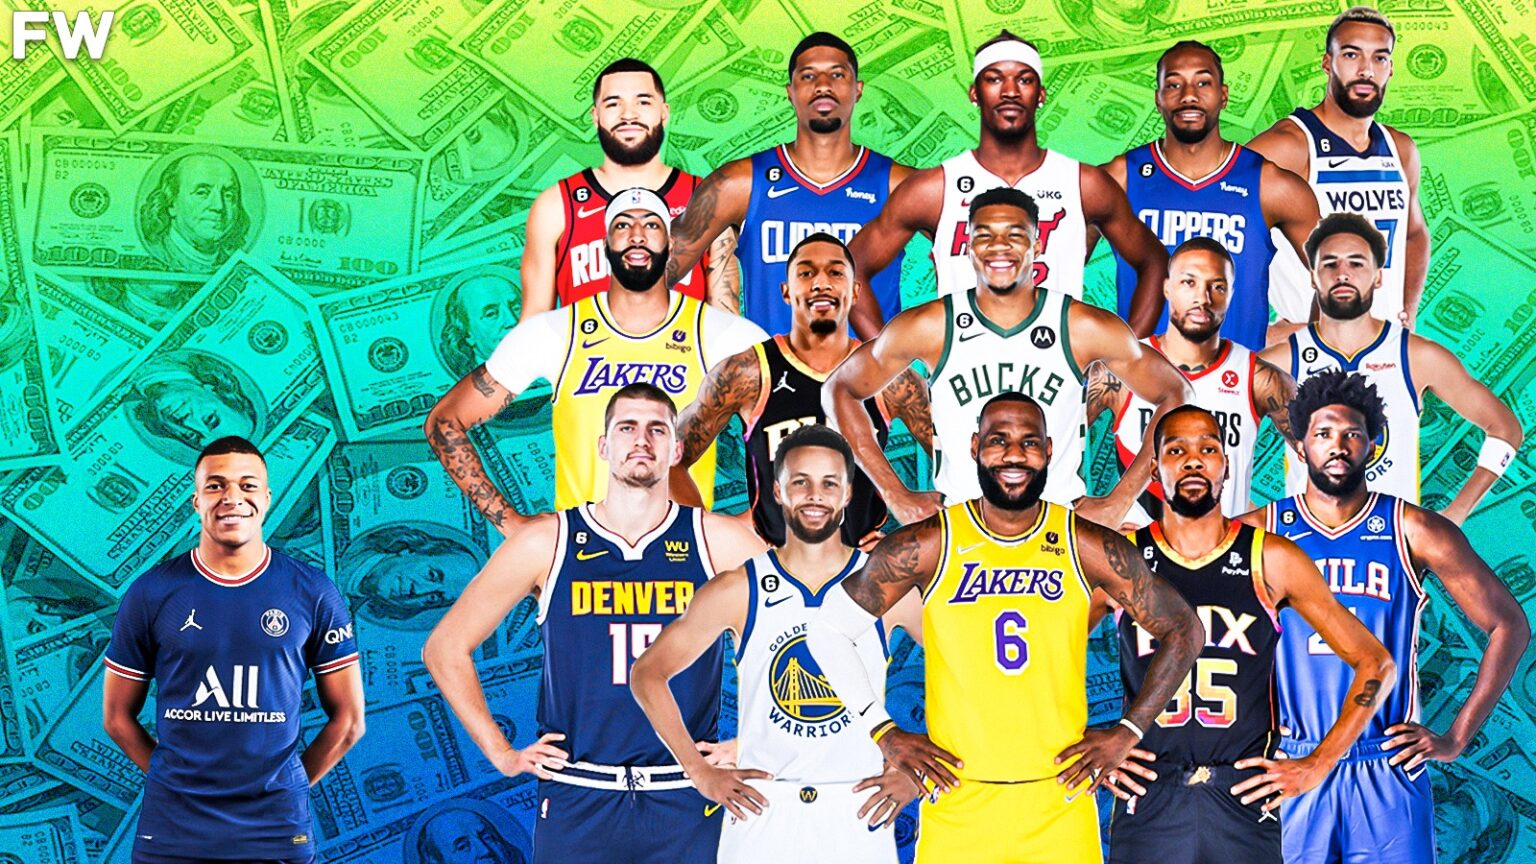
The 2024 NBA salary landscape reflects a transformative era in professional basketball economics, driven by massive television revenue streams, the introduction of the second apron under the collective bargaining agreement, and escalating maximum contract thresholds. This financial ecosystem dictates how franchises construct their rosters, manage luxury tax penalties, and allocate hundreds of millions of dollars to elite superstars. Understanding this framework requires looking beyond simple top-earning leaderboards to examine how the league's salary cap structure actively shapes player compensation and team-building strategies.
The Evolution of the NBA Salary Cap and Revenue Sharing
To comprehend how NBA players command annual salaries exceeding $50 million, one must first analyze the mechanism that governs all financial transactions in the league: the salary cap. The NBA salary cap is a dynamic limit on the amount of money each franchise can spend on player salaries, calculated as a percentage of the league's Basketball Related Income (BRI). BRI encompasses television contracts, ticket sales, arena sponsorships, merchandise, and various licensing agreements.
Under the terms of the Collective Bargaining Agreement (CBA), players collectively receive approximately 49% to 51% of projected BRI. As league revenues climb—propelled by lucrative domestic media rights deals and global expansion—the salary cap rises proportionally each season. For the 2023-24 season, the salary cap was established at $136.021 million, with the luxury tax threshold set at $165.294 million. These figures represent significant increases from previous decades, directly pushing max-contract extensions into unprecedented territory.
| Financial Metric | 2023-24 Season Value |
|---|---|
| Salary Cap | $136.021 Million |
| Luxury Tax Threshold | $165.294 Million |
| First Apron | $172.346 Million |
| Second Apron | $182.794 Million |
Beyond the standard luxury tax, the modern CBA introduced aggressive punitive tiers known as the "aprons." Crossing these financial thresholds severely restricts a team's roster-building maneuvers. The first apron represents a hard soft-cap line for certain transactions, while the second apron acts as a severe penalty zone that eliminates mid-level exceptions, restricts draft-pick trading, and prohibits teams from taking back more salary in trades than they send out. Consequently, teams paying multiple players max salaries face immense structural pressure to balance their remaining roster with minimum-salary players and draft picks on rookie-scale contracts.
Maximum Salary Tiers and Eligibility Rules
An NBA player's earning potential is not arbitrarily determined by open-market bidding; rather, it is strictly regulated by max salary tiers based on years of service in the league. The CBA divides player tenure into three distinct brackets: players with zero to six years of experience, players with seven to nine years of experience, and veterans with ten or more years of experience.
The rookie-scale and early-career tier (0-6 years) limits a player's starting maximum salary to 25% of the total salary cap. The mid-tier (7-9 years) increases this limit to 30% of the cap. Finally, seasoned veterans with ten or more years of service can command a maximum starting salary equivalent to 35% of the salary cap.
Furthermore, exceptional circumstances allow certain players to exceed these standard maximums. The "Designated Veteran Player Extension," commonly referred to as the supermax contract, permits qualified players with seven to nine years of service to sign extensions starting at 35% of the cap if they meet specific awards criteria, such as winning an MVP award, Defensive Player of the Year, or earning All-NBA honors. This mechanism enables incumbent teams to retain their homegrown superstars by offering financial packages that no other franchise can mathematically match in free agency.
Top 10 Highest-Paid NBA Players
When examining the highest-paid players for the 2024 calendar year—encompassing the conclusion of the 2023-24 season and the commencement of the 2024-25 campaign—compensation includes base salaries agreed upon via extensions, veteran max deals, and supermax agreements. Endorsement earnings and off-court business ventures are excluded from these figures, focusing strictly on on-court basketball salaries.
| # | Player | Team | Estimated Salary |
|---|---|---|---|
| 1 | Stephen Curry | Golden State Warriors | $51,915,615 |
| 2 | Nikola Jokic | Denver Nuggets | $47,607,350 |
| 3 | Joel Embiid | Philadelphia 76ers | $47,607,350 |
| 4 | Kevin Durant | Phoenix Suns | $47,649,433 |
| 5 | Bradley Beal | Phoenix Suns | $50,203,930 |
| 6 | LeBron James | Los Angeles Lakers | $47,607,350 |
| 7 | Giannis Antetokounmpo | Milwaukee Bucks | $48,787,676 |
| 8 | Damian Lillard | Milwaukee Bucks | $45,640,084 |
| 9 | Kawhi Leonard | Los Angeles Clippers | $45,640,084 |
| 10 | Paul George | Philadelphia 76ers | $49,205,800 |
Stephen Curry consistently occupies the pinnacle of the salary leaderboard, reflecting his status as the league's premier sharpshooter and cultural icon. His contract extension with the Golden State Warriors broke barriers by pushing past the $50 million annual mark. Similarly, superstars like Nikola Jokic, Joel Embiid, and Kevin Durant command salaries scaled directly to the 35% tier of the league's rising cap structure.
It is worth noting that a player's contract value often reflects the timing of their signature rather than their absolute hierarchical rank among active players. Cap-smoothing rules and annual 8% raises (or 5% raises for players changing teams in free agency) mean that cumulative contract totals can fluctuate significantly from year to year. For instance, Bradley Beal’s inclusion near the top of the earnings list stems from a max contract signed previously with the Washington Wizards that carried over via trade to the Phoenix Suns.
Cap Mechanics: How Supermax and Extension Rules Shape Rosters
The financial burden of maintaining multiple players on maximum salaries forces front offices to navigate complex cap mechanics. A team with two players earning 35% of the cap each has already allocated 70% of its total salary allowance to just two individuals. With the salary cap sitting at $136 million, that leaves approximately $40 million to fill out the remaining ten to twelve roster spots, well below the luxury tax threshold before factoring in any bench depth.
To manage these constraints, teams utilize various cap exceptions:
- The Non-Taxpayer Mid-Level Exception (MLE): Allows teams below the luxury tax to sign free agents for a designated starting salary, independent of cap space.
- Bi-Annual Exception (BAE): Available every two years for teams below the tax apron to acquire rotational talent.
- Rookie Scale Exceptions: Permits teams to sign draft picks directly onto standardized cost-controlled contracts, providing essential cost-effective depth.
- Bird Rights: Enable franchises to exceed the salary cap to re-sign their own qualifying veterans, preventing small- and mid-market teams from losing star players simply due to lack of cap space.
However, the introduction of the second apron has fundamentally altered how luxury-tax-paying teams utilize these tools. Franchises that cross the second apron forfeit the taxpayer mid-level exception entirely, forcing them to rely almost exclusively on minimum-salary contracts and internal player development to round out their rotations.
Comparative Analysis of Player Compensation Models
Analyzing how player compensation has shifted over generations reveals stark contrasts in revenue distribution. In the 1990s and 2000s, max contracts were constrained by lower BRI numbers and more restrictive individual salary limits. The modern era features shorter, higher-value extensions where players often opt out of later years to sign new deals aligned with exponential year-over-year cap spikes.
| Era / Decade | Average Supermax | Cap % Allocation | Apron Severity |
|---|---|---|---|
| 2000s | $15M - $20M Annually | 25% - 30% | Minimal / Tax Only |
| 2010s | $25M - $35M Annually | 30% - 35% | Moderate |
| 2024 Onward | $50M - $60M+ Annually | 35% + Supermax | Severe (2 Aprons) |
This structural evolution has direct consequences for player movement. Because incumbent teams can offer a fifth year and larger annual raises via Bird rights and supermax eligibility, superstars frequently sign extensions with their current clubs before testing unrestricted free agency, subsequently requesting trades if competitive goals are unmet. This dynamic explains why high-salaried players like Kevin Durant, Bradley Beal, and Damian Lillard have changed teams via trade while operating under maximum contract extensions.
Common Misconceptions Regarding NBA Salaries
Navigating NBA financial reporting often leads to widespread public confusion. Fans and media analysts frequently misinterpret gross contract figures as take-home pay, ignoring the substantial deductions that impact actual player compensation.
- Gross vs. Net Income: A reported $50 million salary is subject to federal, state, and local income taxes, agent fees (typically capped between 4% and 10% under NBA Players Association guidelines), and mandatory escrow withholdings. The league withholds approximately 10% of player salaries into an escrow account to ensure the player-to-owner revenue split remains at the agreed-upon 50-50 ratio; depending on league revenues, a portion of this escrow is returned or retained at season's end.
- The "Jock Tax": Professional athletes pay state and municipal taxes based on the specific jurisdictions where games are played. A player residing in Florida (no state income tax) still incurs tax liabilities when playing games in California, New York, or Canada.
- Contract Guarantees: Unlike other professional sports leagues, standard NBA contracts are fully guaranteed unless explicitly negotiated otherwise with specific team-option or non-guaranteed clauses, providing financial security regardless of injury or performance decline.
Practical Implications for Franchise Building
For general managers and team executives, managing the salary cap alongside high-earning superstars is a delicate balancing act of risk management. Committing 35% of a franchise's cap space to a single player requires absolute confidence in that player's durability and long-term production. If a supermax player suffers a career-altering injury, the resulting salary cap inflexibility can immobilize a franchise for half a decade, preventing them from signing impact players or absorbing valuable contracts in trades.
Consequently, modern front offices place a premium on analytical modeling, projecting cap growth years in advance to anticipate when luxury tax lines will shift. Teams must weigh the immediate championship window against future flexibility, often deciding whether it is prudent to cross the second apron or shed salary to reset tax penalties under the repeater tax structure.
Summary and Outlook on Future Salary Trends
The financial architecture governing the 2024 NBA salary list illustrates the intersection of soaring global media rights and rigid collective bargaining controls. While elite players command unprecedented financial compensation exceeding $50 million annually, strict cap rules, luxury tax thresholds, and apron penalties ensure that roster construction remains a complex chess match. As television agreements evolve and the salary cap continues its upward trajectory, player salaries and cap thresholds will scale to even higher altitudes, permanently altering the economics of professional basketball.